Web
3 A/B Testing Tools Compared
If you’re new to A/B testing in general, I recommend Kerry Butters’ articles Are Most Winning A/B Test Results Misleading? and The Designer’s Guide to A/B Testing, both of which include more basic info on what A/B testing is and why it’s important.
Now let’s go on to the reviews.
Optimizely
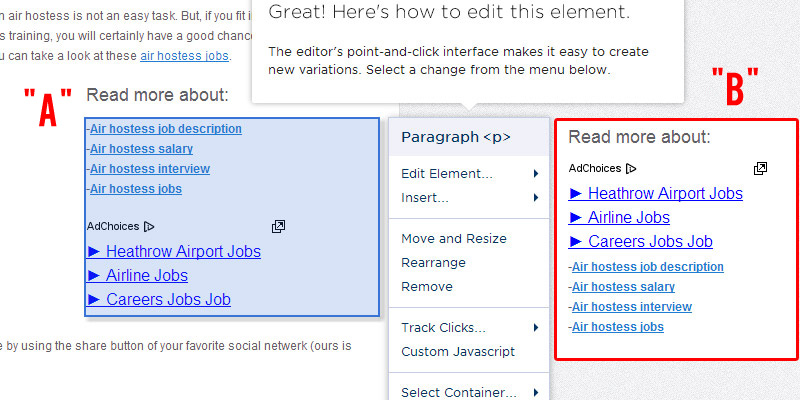
Let’s start by looking at Optimizely. They offer a decently priced entry plan with 2,000 visits per month, which is enough to run a few tests (or one large test). Optimizely requires you to insert a snippet of code in your header (which gets confirmed by email, which is nice) after which you can use their dashboard. You just add a new experiment, and a guide takes you through all the necessary steps.I prepared an experiment to test whether Google Adsense link units should be put below (how it currently is) or above the navigation links. You can see the real page here to get an idea.
I can easily select the related code and make the switch. This is just a test, but if it was a real analysis I would also need to generate new Adsense code to measure the impact in earnings. But for now it’s the concept that matters.
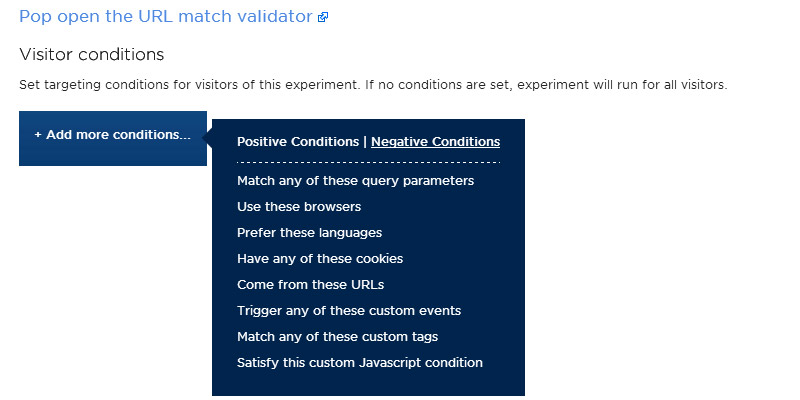
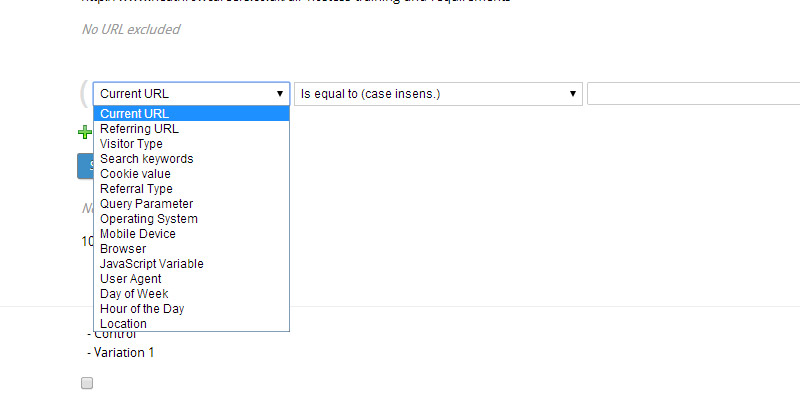
If you run a very popular site, you can add one or more conditions to filter your traffic (like coming from a specific URL), as shown below:
You can also set up goals to show up in your report, but I find the standard set very limited. You can compare on the basis of clicks, pageviews, or custom events that you have to set up yourself with JavaScript.
In their sales pitch, Optimizely states that you don’t have to be a coder to get it working. But if you want to do some serious tracking, some coding is still necessary. I think a more visual approach would be preferred. Coding shouldn’t be necessary after you’ve already placed their tracking script in your header.
Let’s say you want to compare different positions for a newsletter signup box, measuring the signup rate for each position. With Optimizely, you will have to insert some JavaScript code behind your form in addition to the tracking script. This seems redundant.
What about the results from my test? Well, this is the report I was shown.
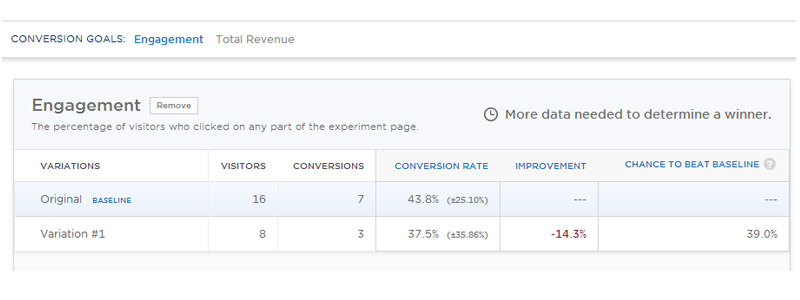
The results are still being collected, but this doesn’t really tell me anything since it isn’t clearly defined what these conversions are (probably clicks). This is just too limited.
Optimizely allows for a lot of integration with heatmap tools like CrazyEgg and ClickTale, and with various analytics tools (including GA). I think at these pricing levels at least some of that functionality should be included out of the box.
Optimizely looks impressive on paper and can certainly be a helpful tool if you don’t mind coding things. But I wish it was more click-and-play so you can stay focused on the testing.
Optimizely offers a free 30-day trial.
Visual Website Optimizer
Now let’s look at Visual Website Optimizer (VWO), which claims you won’t need to code at all. Their pricing is quite steep, but there’s a free trial. VWO begins by taking you through the steps needed to set up your experiment. After that you are given the code to insert, but you can also use plugins for most popular systems like WordPress and Magento.I made the same change to my AdSense link units as with the Optimizely test by editing the HTML. There are a few more ways to modify your page. The easiest way for my example would be using the “Rearrange” function, but that wasn’t working with the AdSense code.
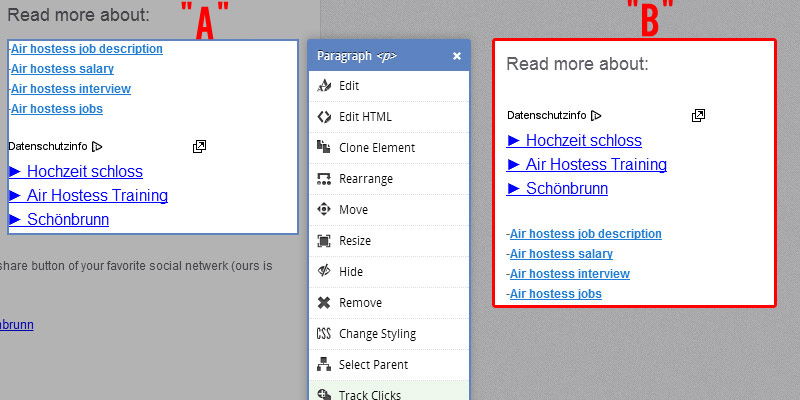
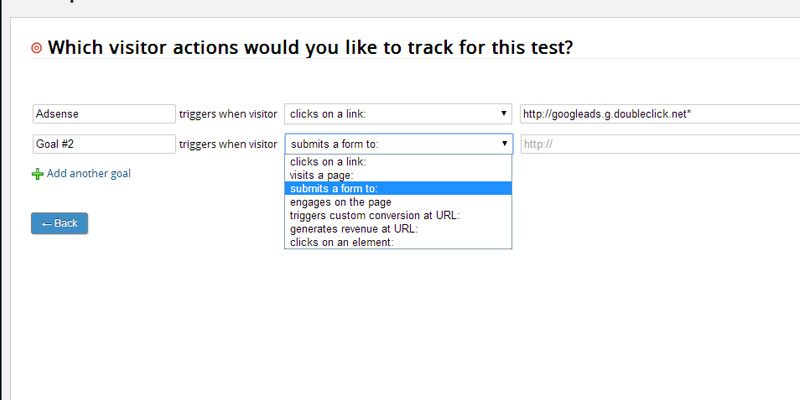
After selecting and changing the HTML, I need to choose what I wanted to test. As you can see, I can be very specific about what to track when it comes to clicks on a link (if the test code allows for it). And there is a way to track signup forms. As with Optimizely, you can filter your traffic based on a whole range of conditions.
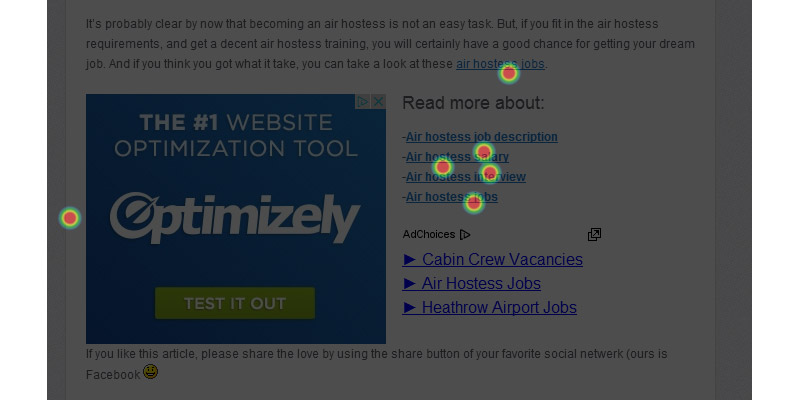
A nice feature of VWO is that it comes with an integrated heatmap, thought it’s not as advanced as a dedicated heatmap tool. Too bad you can’t compare both heatmaps in your A/B tests. And they aren’t very advanced either, since the coloring doesn’t really tell you much. But it’s a nice idea that could improve with a little more development.
VWO comes with a summary report and a detailed report, but to be honest these should be integrated with each other. The detailed report just adds some graphs and filters, but nothing really in-depth. The reports you do get are enough to help you in analyzing your results and use as a basis for further actions.
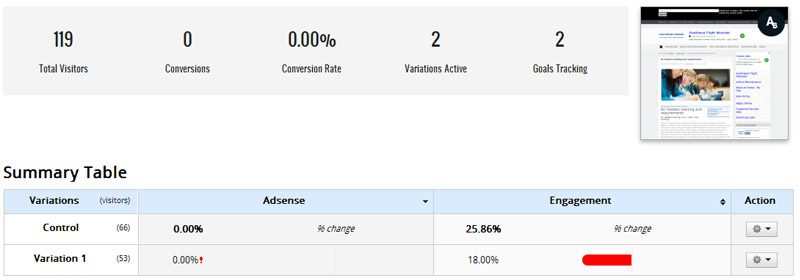
You get a little more information with VWO than with Optimizely. Engagement in this case is measured by overall clicks. Unfortunately I wasn’t able to track the actual clicks on the AdSense ads in the end, due to it being in an iframe.
Visual Website Optimizer gives the click-and-play experience I was missing with Optimizely, and gives you enough ways to measure how visitors respond to changes. The heatmap functionality is nice but not very useful in it’s current form. And even though reporting is a bit more than basic, it still feels too simple.
Visual Website Optimizer offers a free 30-day trial.
Google Analytics Experiments
To conclude this tools comparison, I will have a look at Google Analytics Content Experiments (GACE), previously known as Google Website Optimizer. GACE is a free A/B testing tool that’s part of Google Analytics. It only allows for pure split-testing, and you have to make the different variations yourself (i.e. set up new pages).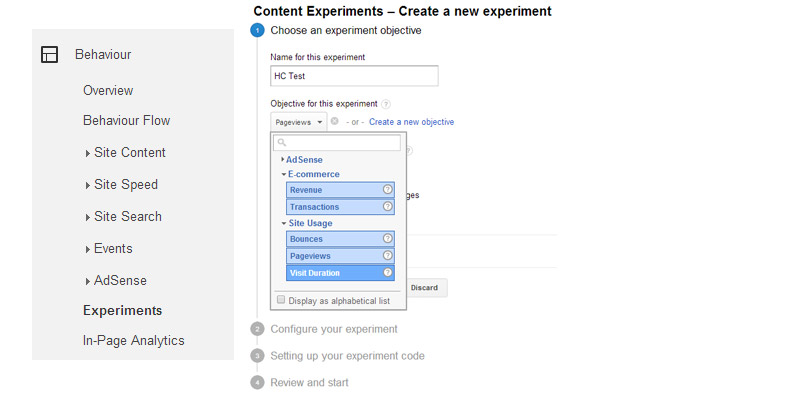
To use GACE, you start by setting up your experiment and defining your objectives (which can also be predefined goals in GA, which is very helpful). You can also run experiments on Adsense results. Then you just have to define two or more testing pages (one being the original), insert some code it’s ready. You can even use your sales funnels and start split-testing these.
On one of my other sites, I have published a Liquid Web review. As you can see, there are prominent blue boxes displayed with a clear call to action. Changing colors requires you to copy the original page, and make the modifications yourself (like I did here). Also, you need to make sure your alternate page isn’t indexed by itself.
After you set up your experiment, you will immediately experience a major downside of GACE: You have to wait for 1-2 days to see results, unlike the two other tools, which are real-time. This means you can’t instantly act on the results coming in. With A/B testing it will definitely help to test over a combination of days, but if you are testing minor tweaks you’ll want to do a few variations per day so you can be sure which changes affected your conversions.
GACE doesn’t allow you to filter your traffic when setting up your experiment, you can only choose which percentage of your traffic should be included in the test.
Another (unnecessary) disadvantage of GACE is that it changes your URL to track the experiment:

While this doesn’t present major problems, it just isn’t very clean and also not very convenient when someone wants to bookmark your link (like I do a lot in Evernote).
GACE does give you the best reporting results in this comparison, because it allows you to compare based on different metrics. Even the ones you didn’t initially set up are shown, but a winner is defined on the metric you put in as objective.
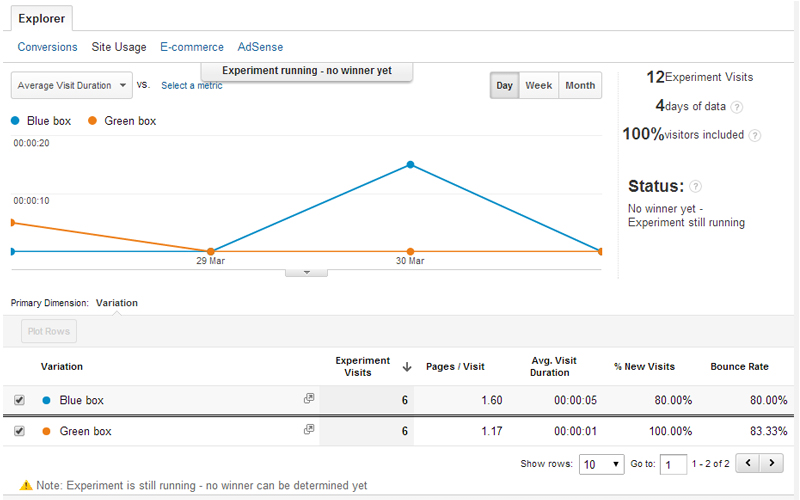
The Content Experiments functionality is very well integrated in the whole GA suite, which offers you some benefits over the other tools. When it comes to the testing itself, it’s rather limited and more time consuming to set it up. It also requires you to be patient. But it gives you an easy way to start with A/B testing without spending any money. And the AdSense integration is very valuable if you run an ad-supported site.
Conclusion
In summary, even though these three products seem to offer the same functionality, the way they handle things is very different.Optimizely gives you lots of possibilities if you don’t mind coding some stuff together, while Visual Website Optimizer is more click-and-play. VWO comes with an extra tool for heatmap tracking, which is a nice feature but too limited. You can use both tools for both basic (changing elements) and advanced (filtering) experiments. But when it comes to reporting there is still room to improve. Documentation for both products is excellent, even if you just want to be educated on the different concepts of A/B testing.
With both products, it still feels like I’m missing important information though. Let’s take visitor origin for example. I can exclude certain segments of visitors so I can tell where they are not coming from, but wouldn’t it be nice to see if UK and US visitors are responding the same way to a change, and see that in a chart? Now it requires you to run two separate tests, and use a separate analytics tool. Maybe I’m asking too much here, but I believe there’s lot of potential in these tools since they already know so much about your traffic.
Both offer a free 30-day trial, so I encourage you to run some tests yourself.
Google Analytics Content Experiments is fully integrated with the rest of the GA suite, but is rather limited in the way tests are performed. It also requires more manual actions to make the adjustments, and you need to be patient before seeing results. But once you’ve set up a nice set of goals or funnels, it’s a great (and free) tool to use.
If you’ve used any of these or know of another tool, please let us know in the comments.

Jacco Blankenspoor is a website
developer from the Netherlands, and is currently involved in job sites
built on WordPress. You can see him in action at his current pet sites: Heathrow Airport Jobs and Airport Jobs, a job engine built on WordPress.
No comments:
Post a Comment