Friday, July 25, 2014

Cómo hacer una web optimizada para SEO


Cómo hacer una web optimizada para SEO

capitulo3 Cómo hacer una web optimizada para SEO
Ahora que ya sabes qué es el SEO y cuáles son los principales factores que Google tiene en cuenta a la hora de posicionar una web lo que te falta es saber qué es lo que tienes que hacer para que tu página web tenga oportunidades reales de posicionar.
En este capítulo vamos a hablar sobre como optimizar los principales factores de posicionamiento así como los principales problemas SEO que surgen a la hora de optimizar una web y sus posibles soluciones.
Los temas que se van a tratar en este capítulo los dividiremos en 3 grandes bloques:
  1. Accesibilidad e indexabilidad
  2. Contenido
  3. Factores técnicos
separador Cómo hacer una web optimizada para SEO

Accesibilidad

Lo primero que hay que hacer a la hora de optimizar una web a para que esta sea accesible para Google en ponernos en la piel de Google. Los usuarios no ven una página web del mismo modo en que la ve un motor de búsqueda, para saber si lo que Google ve es lo que queremos que vea tenemos que seguir una serie de pasos:
  1. Instala este plug-in: Web developer para Mozilla Firefox o Google Chrome
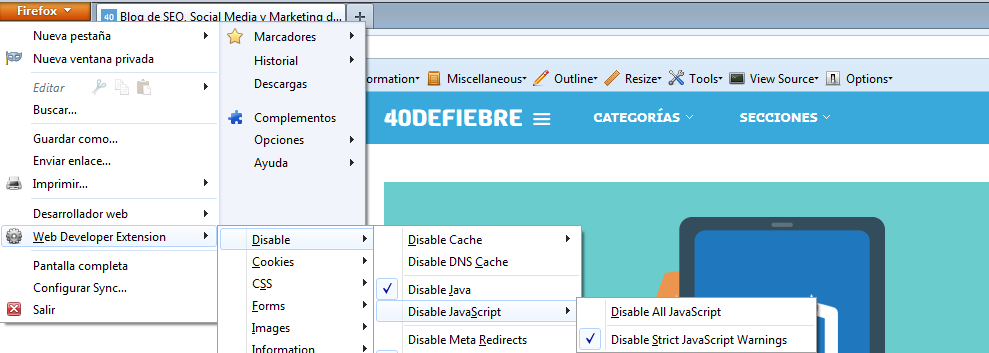
  2. Desactiva el Javascript Esto lo hacemos porque si los menús desplegables por Javascript no son accesibles por Googlebot no podrá rastrear los enlaces que contenga
  3. Google Chrome

    desactivar javascript Cómo hacer una web optimizada para SEO

    Mozilla Firefox

    Firefox Cómo hacer una web optimizada para SEO
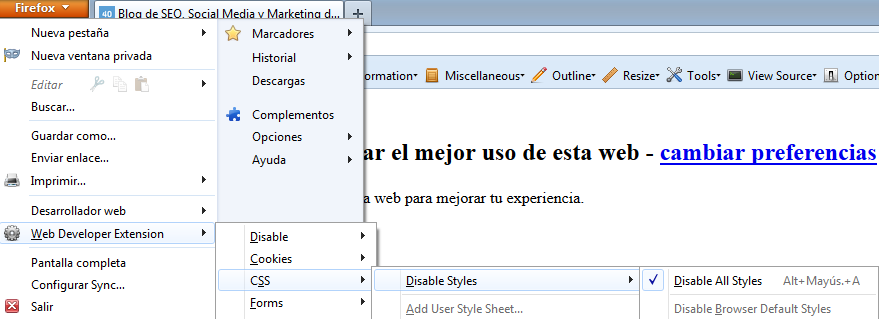
  4. Desactiva los CSS El CSS se desactiva porque Google lee una página en el orden del HTML. Los CSS a veces cambian de lugar los objetos de una página.
  5. Google Chrome

    css chrome Cómo hacer una web optimizada para SEO

    Mozilla Firefox

    css firefox Cómo hacer una web optimizada para SEO
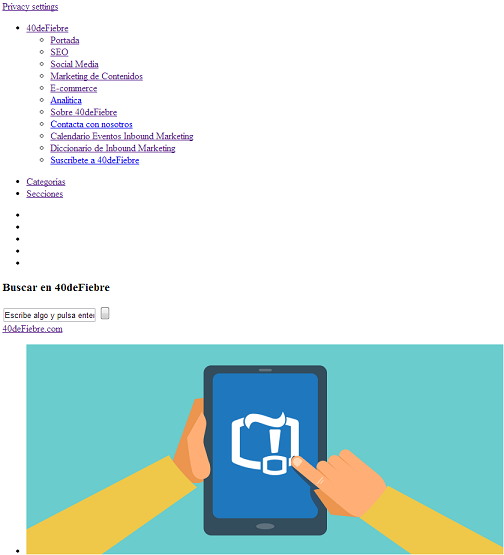
  6. ¿Cómo se ve tu web sin Javascript ni CSS?
Así es como Google ve 40deFiebre. Mucha más bonito que a los ojos de un usuario ¿no? Pero cómo puedes ver los enlaces del menú desplegable son clicables y parece que no hay nada desordenado en la página.
40 de fiebre Cómo hacer una web optimizada para SEO Tienes que tener varias cosas en cuenta cuando compruebes tu página web a los ojos de Google:
  • ¿Puedes ver todos los enlaces de tus menús?
  • ¿Todos los enlaces aparecen como texto plano?
  • ¿Todos los enlaces son clicables?
  • ¿Hay alguna porción de texto que antes no estaba? Si es así trata de arreglarlo cuanto antes, aunque sea involuntario está es una falta muy grave para Google, para él significa que estás ocultando texto a tus usuarios.
  • ¿Está tu sidebar o los widgets de tu web en la parte superior de la página? Es importante que los enlaces más importantes estén en la parte de superior de la página.

Principales problemas de accesibilidad

Hay muchos factores que hacen que una web sea más o menos accesible para Google pero hay ciertos problemas que pueden hacer que el robot de Google no llegue a todas las páginas de nuestra web, sobre todo a las más profundas:

Estructura de la web

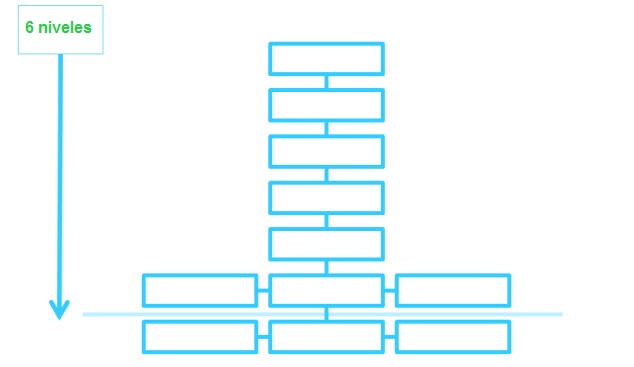
Si la estructura de una web es demasiado profunda ha Google le resultará más difícil llegar a todas las páginas, se recomienda que la estructura no tenga más de 3 niveles de profundidad (sin contar la home) ya que el robot de Google tiene un tiempo limitado para rastrear una web y cuantos más niveles tenga que atravesar menos tiempo le quedará para acceder a las páginas más profundas, por eso siempre se recomienda crear un estructura web en horizontal y no en vertical:

Estructura vertical

6 levels deep Cómo hacer una web optimizada para SEO

Estructura horizontal

flattened to 3 levels deep Cómo hacer una web optimizada para SEO Como puedes ver, en el segundo diagrama la información de la web está mucho mejor organizada por categorías y es mucho más accesible para el robot de Google.

Enlazado interno

El robot de Google usa lo enlaces de una web para viajar entre las páginas y así poder indexarlas, entonces ¿qué pasa si una página concreta de una web no tiene ningún enlace interno ni externo apuntando hacia ella? Pues que el robot de Google no puede acceder a ella.
Es muy importante asegurarse de que todas las páginas de una web tienen al menos un enlace hacia ellas, para comprobar esto usaremos Screaming Frog. Para ello solo tenemos que ejecutar el programa, configurar el filtro para que nos muestre solo las páginas con contenido HTML y hacer scroll hacia la derecha buscando la pestaña “inlinks”.
Por esta razón es muy importante tener una estructura horizontal ya que nos resultará mucho más fácil crear una buen red de enlaces internos

Velocidad de carga

Esto es algo que veremos en detalle más adelante en este mismo capítulo, pero hay que tener en cuenta que además de afectar al posicionamiento en sí tener un tiempo de carga muy alto en una web significa que el robot de Google agotará el tiempo que pase en dicha web sin haber accedido a todas las páginas de la misma.

Indexabilidad

Una vez que el robot de Google ha accedido a una página el siguiente paso es que la indexe, estás páginas se incluyen en un índice donde se ordenan según su contenido, su autoridad y su relevancia para que luego sea más sencillo y rápido para Google acceder a ellas.

¿Cómo comprobar si Google ha indexado mi web correctamente?

Lo primero que tienes que hacer para saber si Google ha indexado tu web correctamente es hacer una búsqueda con el comando “site:”, de este modo Google nos dirá la cifra aproximada de las páginas de nuestra web que tiene indexadas:
2013 10 23 1822 Cómo hacer una web optimizada para SEO Si tienes vinculado Google Webmaster Tools en tu web también puedes comprobar el número real de páginas indexadas desde Indice de Google > Estado de indexación:
sdfasf 1024x233 Cómo hacer una web optimizada para SEO Sabiendo (más o menos) el número exacto de las páginas que tiene tu web este dato te sirve para comparar las páginas que tiene Google indexadas con las páginas reales de tu web. Pueden suceder tres escenarios:
  1. El número en ambos caso es muy similar. Significa que todo está en orden
  2. El número que aparece en la búsqueda de Google es menor, lo que significa que Google no está indexando muchas de las páginas.
  3. El número que aparece en la búsqueda de Google es mayor, lo que significa que tu web tiene un problema de contenido duplicado.
Visto esto es posible que tu web tenga un de dos problemas: Google tiene menos páginas indexadas de las que realmente hay en tu web o Google tiene más páginas indexadas de las que realmente hay en tu web; sea cual sea vamos a ver qué es lo que lo puede estar causando y que acción debemos tomar para solucionarlo.

Google tiene menos páginas indexadas

Este es un problema más común de lo que parece y suele ser debido a dos cosas: el robot de Google no llega a todas las páginas de tu web con lo cual no las puede indexar, para ello revisa la parte de accesibilidad de este mismo capítulo para arreglarlo; y la segunda es que estás bloqueando al robot de Google y por tanto impidiéndole que indexe algunas páginas.
Suponiendo que la accesibilidad de tu web es perfecta vamos a intentar encontrar el modo en el que estás bloqueando al robot de Google y como solucionarlo:

Archivo robots.txt

El archivo robots.txt se usa para impedir a los motores de búsqueda que accedan e indexen ciertas partes de tu web, aunque es muy útil para evitar que Google muestre en los resultados de búsqueda las páginas que no queremos, puede darse la situación de que bloqueemos el acceso a nuestra web sin darnos cuenta.
En este caso extremo, el archivo robots.txt está bloqueando el acceso a toda la web:
User-agent: *
Disallow: /
Lo que debes hacer es comprobar manualmente que el archivo robots.txt (normalmente la URL suele ser www.ejemplo.com/robots.txt) no está bloqueando ninguna parte importante de tu web. Una vez lo compruebes y lo corrijas siguiendo las guías de Google tienes que comprobar que no hay errores a través de Google Webmaster Tools > Rastreo > URLs Bloqueadas.
GWT Cómo hacer una web optimizada para SEO En el caso de que haya algún error con el archivo te aparecerá un icono de error donde podrás ver los fallos que ha detectado.

Meta etiqueta robots

Las meta etiquetas se utilizan para decirle al robot de Google si puede o no indexar esa página y seguir los links que contiene. Lo que tenemos que comprobar es que en ninguna de las páginas que queremos que Google indexe aparezca esto en el código:
<meta name=”robots” content=”noindex, nofollow”>
Para saber rápidamente si alguna página tiene está etiqueta usa de nuevo Screaming Frog clicando en la pestaña directives y buscando el campo de Meta Data 1:
Screaming 1024x211 Cómo hacer una web optimizada para SEO Una vez tengas todas las páginas con está etiquetas solo tienes que eliminarlas.

Frecuencia de cacheo muy baja

Una vez que Google indexa por primera vez una página determina con qué frecuencia volverá a visitar esa página en busca de actualizaciones, esto depende la autoridad y relevancia del dominio al que pertenezca esa página y de la frecuencia con que se actualice.
Para saber cuál es la frecuencia de cacheo de tu página tiene que comprobar de manera manual los días que pasan entre un cacheo y otro usando el comando “cache:www.ejemplo.com” en Google:
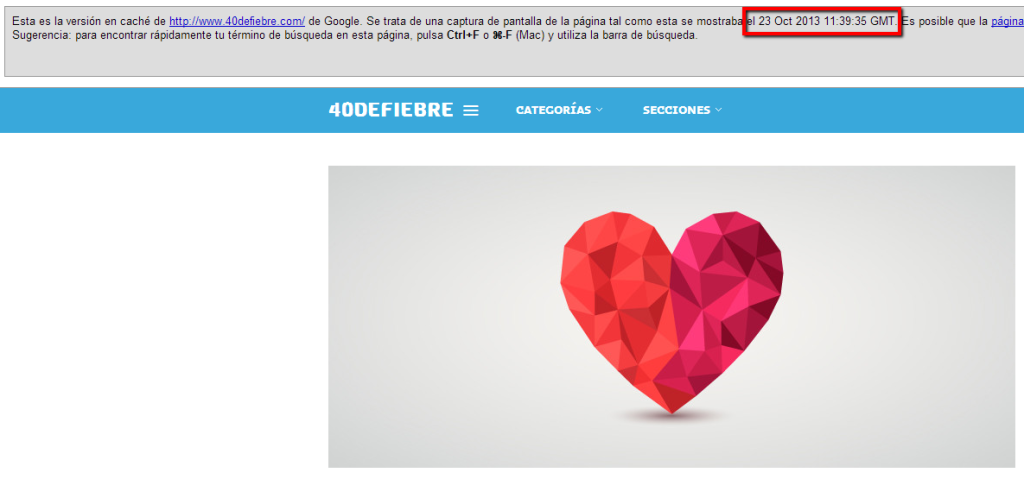
cache 1024x479 Cómo hacer una web optimizada para SEO Compruébalo todos los días hasta que Google la vuelva a cachear, entonces sabrás cual es la frecuencia.
Si consideras que la frecuencia es muy baja puede deberse a 4 motivos:
    1. Tu web no es lo suficientemente relevante para que Google pasee más a menudo por ella
    2. No actualizas a menudo el contenido de tu web
    3. Tu web da demasiados errores de servidor y 404, lo que hace que Google considere que tu página ha perdido relevancia. Para comprobar si la página tiene este tipo de errores consulta en Google Webmater Tools > Rastreo > Errores de rastreo
    4. Has ralentizado La frecuencia de rastreo en Google Webmaster Tools, para modificarla ve a Google Webmaster Tools > Configuración de sitio, lo ideal es dejar que Google decida
rastreo Cómo hacer una web optimizada para SEO

Google tiene más páginas indexadas

Seguramente la razón por la que haya más páginas indexadas de las que realmente hay en tu web es que tengas contenido duplicado o que Google este indexando páginas que no quieres que se indexen. Puedes consultar en Google Webmaster Tools > Aspecto de la búsqueda > Mejoras HTML si tienes páginas duplicadas.

Contenido duplicado

Tener contenido duplicado significa que para varias URLs tenemos el mismo contenido, es un problema muy común que muchas veces es involuntario y que además puede acarrear una penalización de Google, estos son los principales motivos del contenido duplicado.

“Canonicalización” de la página

Este es el motivo más común de contenido duplicado, se produce cuando tu página de inicio tiene más de una URL:
  • ejemplo.com
  • www.ejemplo.com
  • ejemplo.com/index.html
  • www.ejemplo.com/index.html
Cada una de las anteriores dirigen a la misma página con el mismo contenido, si no le indicas a Google de ninguna manera cual es la correcta no sabrá cual tiene que posicionar y puede que sea la que tu no quieras.
Solución
Tienes 3 opciones:
  1. Hacer una redirección en el servidor para asegurarte de que solo hay una página que se muestre a los usuarios.
  2. Definir que subdominio quieres que sea el principal (“www” o “no-www”) en Google Webmaster Tools. Cómo definir el subdominio principal
  3. Añadir una etiqueta “rel=canonical” en cada versión que apunte a las que tu consideres la correcta

Parámetros en la URL

Existen muchos tipos de parámetros, sobre todo en e-commerce: filtros de los productos (color, talla, puntuación, etc.), ordenación (precio menor, por relevancia, precio mayor, en cuadricula, etc.) y sesiones de usuarios. El problema es que muchos de estos parámetros no cambian el contenido de la página, eso genera muchas URLs para el mismo contenido.
  • www.ejemplo.com/boligrafos?color=negro&precio-desde=5&precio-hasta=10
Es este ejemplo podemos ver tres parámetros: color, precio mínimo y precio máximo.
Solución
La solución para cualquier problema con los parámetros es añadir una etiqueta “rel=canonical” hacia la pagina original, con esto podrás evitar cualquier tipo de confusión por parte de Google con la página original.
Otra posible solución es indicar a Google a través de Google Webmaster Tools > Rastreo > Parámetros de URL que parámetros debe ignorar a la hora de indexar páginas en tu web.
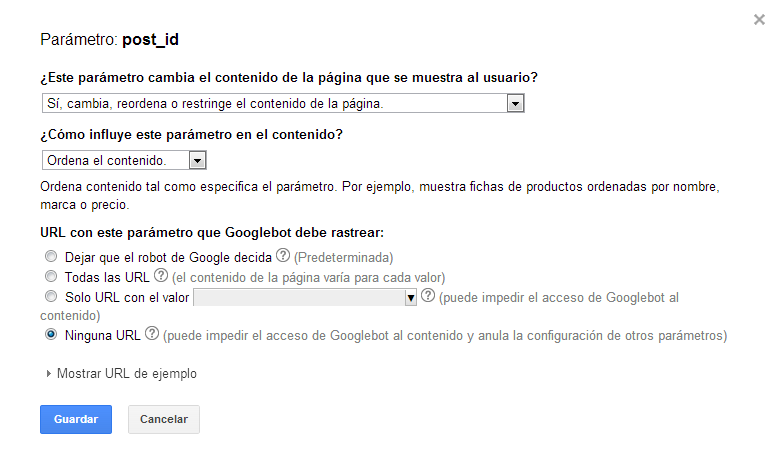
parametros Cómo hacer una web optimizada para SEO

Paginación

Cuando un articulo, lista de productos o páginas de etiquetas y categorías tienen más de una página pueden aparecer problemas de contenido duplicado aunque las páginas tienen contenido diferente, todas están centradas en el mismo tema. Esto es un problema enorme en las páginas de e-commerce donde tienen cientos de artículos en la misma categoría.
Solución
Actualmente existe las etiquetas rel=next y rel=prev que permiten a los motores de búsqueda saber que todas las paginas pertenecen a una misma categoría/publicación, no indexando todas las páginas y centrando todo el potencial de posicionamiento en la primera página.
Cómo usar los parametros NEXT y PREV
Otra solución es buscar el parámetro de paginación en la URL e introducirlo en Google Webmaster Tools para que no se indexe.

Páginas que no queremos que se indexen

La diferencia entre estas páginas y las que clasificamos como contenido duplicado es que estas son páginas únicas pero que por un motivo u otro no queremos que Google la indexe. Para comprobar si hay páginas que no quieres que se indexen pero se están indexando, ya sean páginas privadas o las páginas del proceso de compra de un e-commerce, solo hay que hacer la búsqueda “site:www.ejemplo.com” y comprobar si aparecen dichas páginas en los resultados de búsqueda.
En caso de que esas páginas aparezcan podemos hacer dos cosas:
  1. Añadir la etiqueta <meta name=”robots” content=”noindex, nofollow”>en las páginas que no queramos ver indexadas
  2. Modificar el archivo “robots.txt” para que no se indexen.
Por ejemplo, si tenemos un web en WordPress lo más usual es que no queramos que se indexe en Google el contenido de “/wp-admin”, “/wp-includes”. Para hacerlo del primer modo tendras que incluir las etiqueta “rel=”noindex” en todas las páginas; si lo haces del segundo modo tienes que subir el archivo robots.txt con el siguiente contenido:
User-agent: *
Disallow: /wp-admin/
Disallow: /wp-includes/
separador Cómo hacer una web optimizada para SEO

Contenido

¿Por qué es importante el contenido?

Lo primero que se viene a la cabeza es que para Google “El contenido es el rey”, pero para simplificarlo más una página nunca va a posicionar por algo que no contenga, es decir, si quieres posicionar para “Halloween” y no hablas de Halloween en tu web no lo vas a conseguir.
Vamos a dividir el contenido de la web en dos partes:
  1. SEO On-Site: Sería el contenido que no vemos, es decir, las etiquetas HTML
  2. Textos

SEO On-Site: Meta Etiquetas

En esta sección nos vamos a referir al SEO On-Site como las meta-etiquetas (teniendo el cuenta que dentro del SEO On-Site también entraría la velocidad de carga o el texto). Las etiquetas más importantes que debemos tener en cuenta son las siguientes.
Title
La etiqueta title es el elemento más importante dentro de las meta-etiquetas es lo primero que aparece en los resultados en Google y es lo que se muestra cuando la gente pone el enlace en las redes sociales (excepto Twitter).
Hay que tener en cuenta una serie de cosas a la hora de optimizar el title
  • La etiqueta debe estar en la sección del código
  • Cada página ha de tener un título único
  • No debe de exceder los 70 caracteres, si no aparecerá cortado.
  • Debe de ser descriptivo con respecto al contenido de la página
  • Debe de contener la keyword para la que estemos optimizando la página
  • Nunca debemos abusar de las keywords en el titulo, esto hará que los usuarios desconfíen y que Google piense que estamos intentando engañarlo
Otra cosa a tener en cuenta es donde poner la “marca”, es decir, el nombre de la web, por lo general se suele poner al final para dar más importancia a las keywords, separando estas del nombre de la web con un guión o una barra vertical.
Meta Description
Aunque no es un factor de posicionamiento, afecta de manera considerable a la tasa de clicks (click-through rate) en los resultados de búsqueda.
Para la meta description seguiremos los mismos principios que con el título, solo que la longitud de esta no debe de exceder los 155 caracteres. Tanto para los títulos y la descripciones debemos de evitar la duplicidad, esto lo podremos comprobar en Google Webmaster Tools > Aspecto de la búsqueda > Mejoras HTML.
Meta Keywords
En su momento las meta keywords fueron un factor muy importante de posicionamiento pero en cuanto Google vio lo fácil que es manipular los resultados de búsqueda lo eliminaron como factor de posicionamiento. Dado que su único uso en la actualidad es para categorizar las noticias en Google News lo mejor que puedes hacer es eliminarlas.
Etiquetas H1, H2, H3…
Las etiquetas H1, H2, etc; son muy importantes para tener una buena estructura de información y una buena experiencia de usuario ya que definen jerarquía del contenido, algo que mejorará el SEO de manera considerable. Debemos de darle importancia al H1 porque normalmente está en la parte más alta del contenido y ya que cuanto más arriba este una de keyword más importante les dará Google.
Google Authorship
Una de las etiquetas que más importancia ha ganado en el último año, está etiqueta vincula un contenido a un perfil de Google+ mostrando un resultado de búsqueda enriquecido aunmentando así el CTR (Click Through Rate). Un resultado de búsqueda enriquecido con authorship se vería así:
authoship Cómo hacer una web optimizada para SEO Para implementar correctamente esta etiqueta tienes que seguir una serie de pasos:
    • Tener un perfil de Google+
    • Asegúrate de que en tu foto de perfil se reconoce tu cara
    • En la página del contenido debe aparecer tu nombre
    • El nombre del autor tiene que ser el mismo que el de Google+
    • Debes vincular tu página de Google+ con tu web añadiendo el enlace en “contribuye en”
asdasd Cómo hacer una web optimizada para SEO
    • Tienes que vincular el contenido con la página de Google+ en el código de la página
asdasd1 1024x106 Cómo hacer una web optimizada para SEO Etiqueta “alt” en la imagen
La etiqueta “alt” en las imágenes se añade directamente en el propio código de la imagen:
<img src=”http://www.ejemplo.com/ejemplo.jpg” alt=”keyword molona” />
Esta etiqueta tiene que ser descriptiva con respecto a la imagen y contenido que rodea a la imagen ya que es lo que lee Google al ver una imagen y uno de los factores que usa para posicionarla en Google Imágenes.

Textos

El contenido es la parte más importante de una web y por mucho que tu web este muy bien optimizada a nivel SEO, si el contenido no es relevante con respecto a las búsquedas que realizan los usuarios nunca vas a aparecer en las primeras posiciones.
Para crear buen contenido que siga las directrices de Google hay que tener una serie de cosas en cuenta:
  • La página tiene suficiente contenido, aunque no hay una medida estándar de cuanto es “suficiente” se recomienda que al menos contenga 300 palabras
  • El contenido tiene que ser relevante, útil para el lector, simplemente preguntándonos si nosotros leeríamos eso, nos daremos la respuesta
  • Los textos deben contener las keywords para las que queremos posicionar
  • Tiene que estar bien escrito, es decir, no puede tener faltas de ortografía, errores de sintaxis o datos erroneos
  • Ha de ser fácil de leer, si no se nos hace tediosa la lectura, estará bien.
  • Tiene que ser enlazable, si no le facilitamos al usuario como compartirlo es muy probable que no lo haga. Pon botones de compartir en redes sociales en lugares visibles de la página que no estorben la visualización del contenido, ya sea un vídeo, una foto o texto
  • Debe ser actual, cuanto más actualizado este tu contenido mayor será la frecuencia de rastreo de Google en tu web y mejor será la experiencia del usuario.

Problemas con el contenido

En el SEO, cómo en todo, si nos pasamos con algo puede convertirse en un problema, para Google es muy importante que los textos estén bien optimizados pero sin pasarse, en caso de que detecte un sobre optimización del texto podemos caer en un penalización. Por eso debemos evitar los siguientes errores:
Keyword Stuffing
El keyword stuffing es una técnica considerada black hat SEO por Google en la que se redacta un texto con una gran densidad de palabras clave o KW density con el objetivo de posicionar por esa palabra clave.
Google penaliza con mucha frecuencia este tipo de sobre-optimización. Para evitar cualquier tipo de acción negativa por parte de Google los textos siempre deben redactarse para proporcionar valor al usuario de la forma que más se adapte a tu perfil de público si el texto consigue dar una información mejor, más original, diferente, mejor sintetizada o que aporte más valor, eso será un indicador para Google mucho mejor que cualquier variación en el número de keywords que haya en el texto.
Canibalización
La canibalización de keywords ocurre cuando en una web hay varias páginas que compiten por las mismas palabras clave, con lo que se está confundiendo al motor de búsqueda al no saber que página es la más relevante para esa palabra clave, causando una perdida en el posicionamiento.
Este problema es muy común en los e-commerce que al tener varias versiones de un mismo producto atacan con todas ellas a las mismas keywords, por ejemplo, si vendes un libro en versión tapa blanda, tapa dura y versión digital tendrás 3 páginas con prácticamente el mismo contenido. Para solucionarlo lo mejor crear una página principal del producto desde donde se acceda a las páginas de los diferentes formatos en las que incluiremos una etiqueta canonical a la página principal del producto como hace Amazon:
bears 1024x373 Cómo hacer una web optimizada para SEO Lo óptimo siempre será centrar cada keyword en una sola página para evitar cualquier problema de canibalización.
Texto oculto para Google
Google cada vez es más “inteligente” a la hora de leer el contenido incluido en una web, ya es capaz de leer el texto incluido dentro del Javascript y tarde o temprano acabará leyendo el texto dentro de las imágenes, pero como de momento no es así lo mejor que podemos es evitar publicar texto importante dentro de las imágenes.
separador Cómo hacer una web optimizada para SEO

Factores técnicos: Velocidad de carga

La velocidad de carga además de ser un factor importantísimo en el posicionamiento web hará que tus usuarios se enamoren de tu web, porque ¿a quién no le gusta entrar en un página web y que cargue en un momento? En esta sección veremos cómo detectar que es lo que ralentiza la carga de tu web y como solucionar alguno de los problemas más comunes.

Medir la velocidad de carga con Google Page Speed

Google Page Speed es la herramienta gratuita que ofrece Google para medir la velocidad de carga de una página que además da información sobre qué es lo que ralentiza la carga y cómo arreglarlo.
Lo primero que tienes que hacer es usar la herramienta en la home de tu web
google page speed Cómo hacer una web optimizada para SEO Lo primero que te muestra la herramienta es la “nota media” de tu web, una vez sepas esto es hora de saber qué es lo que más está ralentizando tu web, hay tres tipos de mejoras según su prioridad:
reglas speed Cómo hacer una web optimizada para SEO Por supuesto lo primero que tienes que hacer es centrarte en las mismas importantes, solo tiene que clicar en icono y se desplegará la explicación completa con unos cuantos ejemplos:
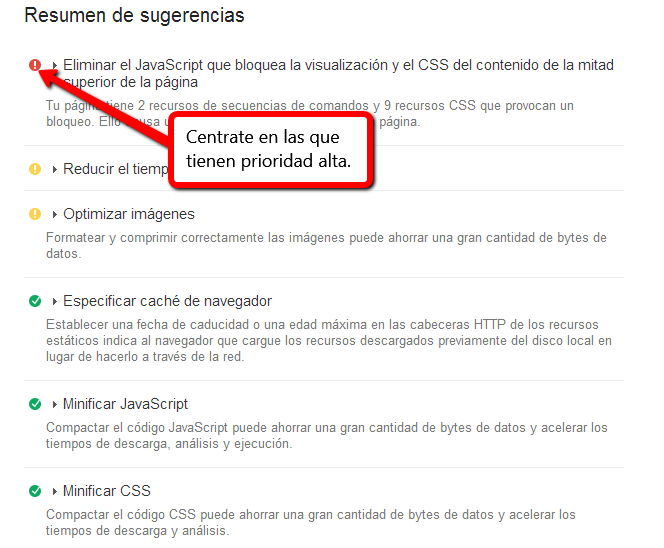
google page speed 2 Cómo hacer una web optimizada para SEO Lo siguiente que debes hacer es usar la herramienta en las páginas interiores de tu web, sobre todo en las que son diferentes a la home, por ejemplo, en 40defiebre tenemos el diccionario de Inbound Marketing que es completamente diferente a nuestra home
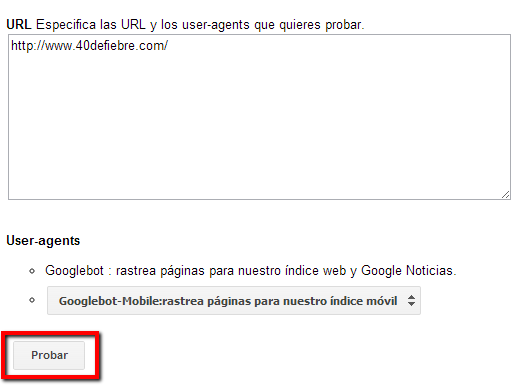
google page speed 3 Cómo hacer una web optimizada para SEO No nos podemos olvidar de la velocidad de carga en los dispositivos móviles. Haz el mismo proceso que con la versión de escritorio
google page speed 4 Cómo hacer una web optimizada para SEO

Encontrar imágenes que optimizar en la web

Las imágenes es uno de los factores que más ralentizan una web y que además es muy fácil que caigamos en él.
Con Google imágenes
  1. Lo primero que tienes que hacer es usar el comando “site:” para buscar todas las imágenes de tu web
  2. images Cómo hacer una web optimizada para SEO
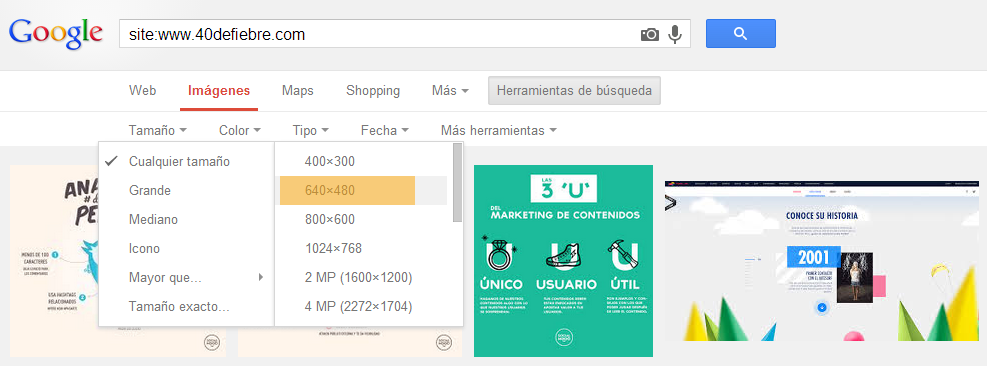
  3. Filtra las imágenes según el tamaño, empieza con un tamaño intermedio para descartar todas las imágenes pequeñas:
  4. images 2 Cómo hacer una web optimizada para SEO
  5. Busca las fotos que sepas que no se muestran grandes en tu web y mira el tamaño real que están ocupando:
  6. images 21 Cómo hacer una web optimizada para SEO
  7. Reduce en lo posible el tamaño de la imagen y pásala por Yahoo Smush.it, esta herramienta optimizará tu imagen al máximo eliminando información innecesaria de ella.
Con Web Developer
Este es el método más rápido de ver la imágenes redimensionadas de la un página concreta, el único pero es que tienes que ir página por página:
  1. Instala Web developer para Mozilla Firefox o Google Chrome
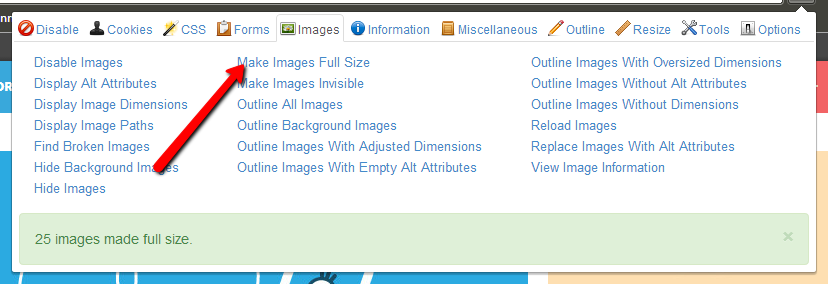
  2. Re dimensiona las imágenes con Google Chrome
  3. web developer Cómo hacer una web optimizada para SEO
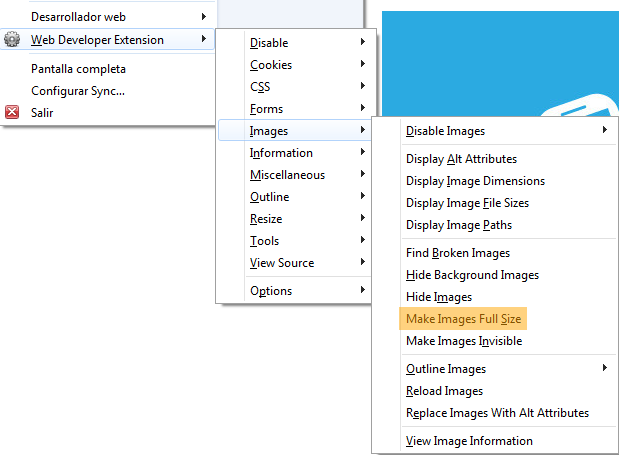
  4. Re dimensiona las imágenes con Mozilla Firefox
  5. web developer 2 Cómo hacer una web optimizada para SEO
  6. Reduce en lo posible el tamaño de la imagen y pasala por Yahoo Smush.it, esta herramienta optimizará tu imagen al máximo eliminando información innecesaria de ella.
Con Screaming Frog
Lo mejor de buscar imágenes con Screaming Frog es que te puedes descargar un CSV con todas las URLs de las imágenes:
  1. Descárgate Screaming Frog
  2. Introduce tu web en el programa y clica en la pestaña de “images”
  3. screaming Cómo hacer una web optimizada para SEO
  4. Filtra las imágenes que pesen más de 100kb y exportalo
  5. screaming 2 Cómo hacer una web optimizada para SEO
  6. Cómo en la dos anteriores, reduce en lo posible el tamaño de la imagen y pasala por Yahoo Smush.it, esta herramienta optimizará tu imagen al máximo eliminando información innecesaria de ella.

Herramientas para optimizar la velocidad de tu web

  • Google Closure: Es un programa de Google que permite minificar los Javascript en un solo archivo.
  • LESS: LESS es un programa que permite crear CSS de forma automática además de optmizarlos haciéndolos más pequeños. Para Windows e iOs
  • Yahoo! Mush.It: Está herramienta de Yahoo! elimina información innecesaria de las imágenes sin que disminuya la calidad de las mismas
  • Yslow de Yahoo!: Yslow es la extensión de Yahoo! para medir la velocidad de una página. Tiene la ventaja de que la puedes usar sin tener que abrir ningún programa en cualquier momento
  • Pingdom Speedtest: Junto con Google Page Speed es la herramienta más usada para medir la velocidad de carga. Lo mejor de esta herramienta es que te detalla el orden en que se cargan las cosas, el tiempo que tardan en cargarse y el nivel de optimización de cada tiempo de carga.

Thursday, July 24, 2014

Kill Useless Web Metrics: Apply The "Three Layers Of So What" Test

Occam's Razor
by Avinash Kaushik

Kill Useless Web Metrics: Apply The "Three Layers Of So What" Test

threeData, data everywhere yet nary an insight in sight.
Is that your web analytics existence?
Don't feel too bad, you share that plight with most citizens of the Web Analytics universe.
The problem? The absolutely astonishing ease with which you can get access to data!
Not to mention the near limitless potential of that data to be added, subtracted, multiplied, and divided to satiate every weird need in the world.
You see just because you can do something does not mean you should do it.
And yet we do.
Like good little Reporting Squirrels we collect and stack metrics as if preparing for an imminent ice age. Rather than being a blessing that stack becomes a burden because we live in times of bright lovely spring and nothing succeeds like being agile and nimble about what we collect, what we give up, and what we deliberately choose to ignore.
The key to true glory is making the right choices.
In this case its making right choices about the web metrics we knight and sent to the battle to come back with insights for our beloved corporation to monetize.
A very simple test can allow you to figure out if the metric you are dutifully reporting (or absolutely in love with) is gold or mud.
It is called the Three Layers of So What test. It was a part of my first book, Web Analytics: An Hour A Day.
What's this lovely test?
Simple really (occam's razor!):
Ask every web metric you report the question "so what" three times.
Each question provides an answer that in turn raises another question (a "so what" again). If at the third "so what" you don't get a recommendation for an action you should take, you have the wrong metric. Kill it.
the three test
This brutal recommendation is to force you to confront this reality: If you can't take action, some action (any action!), based on your analysis, why are you reporting data?
The purpose of the "so what" test is to undo the clutter in your life and allow you to focus on only the metrics that will help you take action. All other metrics, those that fall into the nice to know or the highly recommended or the I don't know why I am reporting this but it sounds important camp need to be sent to the farm to live our the rest of their lives!
Ready to rock it?
Let's check out how you would conduct the "so what" test with a couple of examples.
Key Performance Indicator: Percent of Repeat Visitors.
You run a report and notice a trend for this metric.
Here is how the "so what" test will work:
"The trend of repeat visitors for our website is up month to month."
So what?
"This is fantastic because it shows that we are a more sticky website now."
(At this point a true Analysis Ninjas would inquire how that conclusion was arrived at and ask for a definition of sticky, but I digress.)
So what?
"We should do more of xyz to leverage this trend." (Or yxz or zxy – a specific action based on analysis of what caused the trend to go up.)
So what?
If your answer to that last "so what" is: "I don't know… isn't that a good thing… the trend is going up… hmm… I am not sure there is anything we can do… but it is going up right?"
At this point you should cue the sound of money walking out the door.
Bottom-line: This might not be the best KPI for you.
Let me hasten to point out that there are no universal truths in the world (though some religions continue to insist!).
Perhaps when you put your % of Repeat Visitors KPI to the "so what" test you have a glorious action you can take that improves profitability. Rock on! More power to you!
many exit signs
Key Performance Indicator: Top Exit Pages on the Website.
[Before we go on please know that top exit pages is a different measurement than top pages that bounce.]
You have been reporting the top exit pages of your website each month, and to glean more insights you show trends for the last six months.
"These are the top exit pages on our website for the last month."
So what? They don't seem to have changed in six months.
"We should focus on these pages because they are major leakage points in our website."
So what? We have looked at this report for six months and tried to make fixes, and even after that the pages listed here have not dropped off the report.
"If we can stop visitors from leaving the website, we can keep them on our web site."
So what? Doesn't everyone have to exit on some page?
The "so what" test in this case highlights that although this metric seems to be a really good one on paper, in reality it provides no insight that you can use to drive action.
Because of the macro dynamics of this website, the content consumption pattern of visitors does not seem to change over time (this happens when a website does not have a high content turnover – like say a rapidly updating news site), and we should move on to other actionable metrics.
Here the "so what" test not only helps you focus your precious energy on the right metric, it also helps you logically walk through measurement to action.
conversion rate efficiency
Key Performance Indicator: Conversion Rate for Top Search Keywords.
In working closely with your search agency, or in-house team, you have produced a spreadsheet that shows the conversion rate for the top search keywords for your website.
"The conversion rate for our top 20 keywords has increased in the last three months by a statistically significant amount."
So what?
"Our pay-per-click (PPC) campaign is having a positive outcome, and we should reallocate funds to these nine keywords that show the most promise."
Okay.
That's it.
No more "so what?"
With just one question, we have a recommendation for action. This indicates that this is a great KPI and we should continue to use it for tracking.
Notice the characteristics of this good KPI:
#1: Although it uses one of the most standard metrics in the universe, conversion rate, it is applied in a very focused way – just the top search keywords. (You can do the top 10 or top 20 or as many "head keywords" as it makes sense in your case, just be aware this does not scale to the "mid" or "tail".)
#2: It is pretty clear from the first answer to "so what?" that for this KPI the analyst has segmented the data between organic and PPC. This is the other little secret: no KPI works at an aggregated level to by itself give us insights. Segmentation does that.
task completion rate 2
Key Performance Indicator: Task Completion Rate.
You are using a on-exit website survey tool like 4Q to measure my most beloved metric in whole wide world and the universe: task completion rate. (You'll see in a moment why. :)
Here's the conversation…
"Our task completion rate is down five points this month to 58%."
So what?
"Having indexed our performance against that of last quarter, each one percent drop causes a loss of $80,000 in revenue."
So what? I mean in the name of thor, what do we do!
"I have drilled down to the Primary Purpose report and most of the fall is from Visitors who were there to purchase on our website, the most likely cause is the call to action on our landing pages and a reported slowness in response when people add to cart."
Good man. Here's a bonus and let's go fix this problem.
Nice right?
Notice in this case you have a inkling to the top super absolutely unknown secret of the web analytics world: If you tie important metrics to revenue that tends get you action and a god like status.
Keep that in mind.
So that's the story of the "so what" test. A simple yet effective way of identifying the metrics that matter.
This strategy is effective with all that we do, but it is particularly effective when it comes to the normal data puke we call the "management dashboard". Apply the "so what" test and you'll make it into a Management Dashboard.
Closing Summary:
Remember, we don't want to have metrics because they are nice to have, and there are tons of those.
We want to have metrics that answer business questions and allow us to take action—do more of something or less of something or at least funnel ideas that we can test and then take action.
The "so what" test is one mechanism for identifying metrics that you should focus on or metrics that you should ditch because although they might work for others, for you they don't pass the "so what" test.
And killing metrics is not such a bad thing. After all this is the process that has been proven to work time and time again:
web analytics metrics lifecycle process 1
More here: Web Metrics Demystified.
Ok now it's your turn.
Do you have a test you apply to your web metrics? What are your strategies that have rescued you during times of duress? What do you like about the "so what" test? What don't you like about it? Do you have a metric that magnificently aced the "so what" test?
Please share your comments, feedback and life lessons via comments.
Thanks.
PS:
Couple other related posts you might find interesting:

Best Web Metrics / KPIs for a Small, Medium or Large Sized Business

Occam's Razor
by Avinash Kaushik

Best Web Metrics / KPIs for a Small, Medium or Large Sized Business

sunshine We have access to more data than God wants anyone to have. Thus it is not surprising that we feel overwhelmed, and rather than being data driven we just get paralyzed. Life does not have to be that scary. In fact a data driven life is sexiest digital life you can imagine.
In this blog post we are going to bring the sexyback. I am going to attempt to significantly simply your life by recommending the critical few metrics you should use to analyze performance of your digital marketing campaigns and website. You'll be able to quickly go from "omg what can I do!" to "omg what am I going to do with all the money and fame I'm earning!"
The approach I'm going to use is to 1. Use my Acquisition, Behavior and Outcomes framework to ensure an end-to-end view of important activity and 2. Recommend metrics / KPIs you can use based on the size of your company.
Each recommendation comes with hints on what analysis to perform once you have the data, and what changes you could make to your campaigns, content and overall digital strategy. [A summary in pictorial format is at the end of this post.]
Excited? Let's do this!
Best Metrics / KPIs for Small Business Websites
Small business websites are a very fragile ecosystem. People working hard to do the best they can on the smallest possible budgets. But not to worry. They have to start with just four simple metrics to start rocking!
Acquisition:
Clicks? Visits? Backlinks? Impressions? No. We have something magnificent.
Cost Per Acquisition.
Obsess about this metric. You have very little money. You need to know, obsessively, what you get for it. This metric delivers that insight. Oh, and everything has a CPA (not just your paid search or display/banner ads). If you are doing SEO then you are likely paying for someone. That's the cost.
cost per acquisition 3
Kill things that don't have an optimum CPA. Invest more in ones that do. Simple enough, right?
Tip: Remember this is just cost, not profit. If your product costs you $15 to make then, in the above scenario, you are shipping a crisp $5 bill along with every Social Media order!
Where is it? Most likely in Excel. For Search it is in your Google Analytics or Omniture Site Catalyst reports. But for most other programs (Affiliate, Email, Social, Display) your Cost is likely sitting outside your web analytics tool. So extract the # of conversions, import into Excel, add a column for Cost, do the math, sing or weep (based on what the data says!:)).
If you are paying someone to do web analytics and this metric is not on top of the dashboard they've created for you, it might be time to say sayonara to them.
Behavior:
Page Views? Time on Site? No. You can do so much better!
Bounce Rate.
I continue to be a believer in trying to prompt love at first sight. Okay, okay, I'll settle for delivering relevance. :) Bounce Rate helps you identify campaigns where you might be targeting wrong people (who then come to your site and leave right away) or sending relevant traffic to irrelevant (and often flash-filled hideous) landing pages.
Bounce rate helps you find campaigns and landing pages that need to be killed / improved. Everyday.
Where is it? Standard metric in every web analytics tool worth anything. Look at your All Traffic Sources report and your Landing Pages report.
Checkout Abandonment Rate.
I find the fastest way to make money is to take it from the people who have already decided to give it to you. Obsess about checkout abandonment rate (the percentage of people who click Start Checkout to those who complete that process).
paditrack funnel setup
Focus on checkout steps with the highest abandonment. Tweak like crazy. A/B & Multivariate tests are a good option. But you are a small business… so just take away as many fields as you can, play with where to show shipping cost (I vote for way up front), reduce the number of checkout steps if you can, ask for account creation at the end of the process rather than at the start. Try, test, measure, be rich.
Where is it? In Excel. Or if you use Google Analytics: In Paditrack for free. (Google Analytics' native funnels are pretty sub optimal, ignore that entire feature.) For other tools: In KissMetrics. Create a funnel just for the checkout process (from clicking Start Checkout to Thanks for your Order) and both these tools will give you the metric automatically. They also allow you to segment the data! Make love to it.
[Bonus: What is abandonment rate?]
Outcomes:
My favorite Economic Value? No. As a small business I recommend…
Macro Conversion Rate.
You are a small business. Obsess about conversion rates, and everything connected to improving them. What products are people buying? Every single day (okay week) look at the All Traffic Sources report and seek out the Conversion Rate metric. Ruthlessly punish sources that are not working well and reward the pretty babies. Be they Earned, Owned and Paid media – oh and have a marketing strategy that has each of those elements or as a small business owner you are not going to win a lot.
macro ecommerce conversion rate
I love creating an advanced segment with just the people who buy twice the average order size. I call them the Whales. Look at sources, locations, product bundles purchased, keywords and campaigns and all that to learn where/how you can find more Whales.
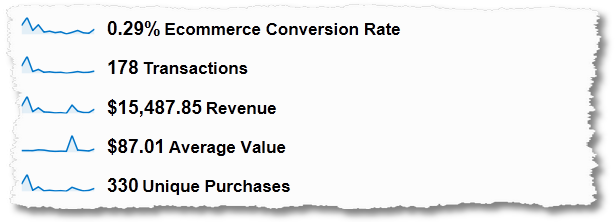
Where is it? Standard metric in all analytics tools. Remember to look at both the rate and the raw number of conversions for context. People make silly decisions when they don't do that.
That's it!
You are a small sized business and these four simple key performance indicators will literally rock your world as soon as you start measuring them. Cost Per Acquisition. Bounce Rate. Checkout Abandonment Rate. Macro Conversion Rate. Don't look at any other metric until you feel you've mastered them.
Tip: If you've hired the right analytics talent/consultant to help you, they'll be measuring these fabulous four.
Best Metrics / KPIs for Medium Sized Business Websites
What if you are a medium sized business? What key performance indicators are optimal for you?
First, you are going to measure the KPIs mentioned above. But because you are running a bigger and more complex business you'll also measure…
Acquisition:
CPA
+ Click-through Rate
While CPA is a macro metric about your campaigns' bottom-line performance, Click-thru Rate (CTR) is a deeper dive into analyzing the creativity and relevance of your affiliate deals / search listing / blinky banner ads.
In the context of Search (Paid or Organic), the text in your ads, the number at which your listing is ranked, the match between the user query and your ad's intent all help you receive a higher CTR. And if someone comes to your site (and does not bounce!) then you get an opportunity to convince them of your product or service's glory.
click through rate custom report
Small tweaks to the subject line of your email campaigns can have dramatic improvement in CTR. Recency and Frequency capping of your display remarketing campaigns can have a huge impact. Changing demographic targeting options in your Facebook ads can work wonders. Etc., etc., etc.
Put another way… CTR helps you understand if you showed up at the right place for your first date. Are you dressed okay. And if you are smiling the right smile. Helpful to know, right?
Where is it?
Everywhere. Start at a campaign level. Drill down to individual creatives. Kill badness. Promote goodness. Rinse. Repeat.
Behavior:
Bounce Rate
Checkout Abandonment Rate
+ Page Depth
A very tiny percentage of visitors to your site will see more than a couple pages. That's the internet for you. As you improve the user experience, information architecture and relevancy of content on your site, it is important to keep an eye not on the rather useless metric of Average Page Views per Visit or Average Time on Site but rather on the distribution of page depth. Here's how that picture might look like (from a post I wrote in July 2006!)…
page depth analysis
From the deep detail reported by your web analytics tool you can choose to aggregate into buckets you most care about (like mine above). Categorizing the visits into Abandoners, Flirts, Browsers, One-off-Wonders, Loyalists will dramatically change your view of content consumption. Over time, as you move to deeper consumption, you'll see direct business rewards.
The above image emphasizes a sale/conversion at the end, but even if you are a content-only website improving Page depth helps you because more pages equal (at the very minimum) more ad impressions!
Where is it? The final table will be in Excel. If you use Google Analytics the data you need is here: Audience > Behavior > Engagement > Page Depth tab. If you use WebTrends, Yahoo! Analytics, Coremetrics please click around to find the data. They all have it.
+ Loyalty (Count of Visits)
If Page Depth helps you optimize for a single session experience, Loyalty helps you optimize pan session behavior. Put another way… how good are you at getting the same person to visit your website multiple times? For ecommerce or non-ecommerce websites, loyalty can mean the difference between life of survival and raking in profits like crazy.
First set a goal for the % of site Visits you would like for people who've visited more than x times. [Set a goal for x too. :)] For ecommerce websites use your Days to Conversion report (more on this metric below) to set your goal. For content sites perhaps mirror your content update schedule. If you are the New York Times and you update the website 24 times a day then should the average person be visiting the site at least 90 times per month?
Your BFF, as always, is analysis and not just reporting the metric. Create this simple segment in five seconds…
segmenting by visitor loyalty
Apply to your keywords and campaigns and referring sources reports and identify which sources drive loyal traffic. Apply it to your content reports and figure out which content drives Loyalty (Sports? Op Ed? International? Cat Stories?).
Where is it? In every web analytics tool on the planet. If you use Google Analytics the data you need is here: Audience > Behavior > Frequency & Recency.
Outcomes:
Macro Conversion Rate.
+ Micro Conversion Rate
Pick your favorite benchmark and you'll notice that less than 2% of visitors convert. Focusing on just the Macro Conversion Rate means you don't care if you received any business value from the 98% that did not convert. I refuse to accept that uber-lameness.
Identify your Micro Conversions (/Goals) and obsess about the long and short term business value they deliver. You'll quickly realize the Economic Value they create for you is often far greater than the Revenue your Macro Conversion reports! And optimizing for that will ensure you win HUGE.
micro conversion rates
Where is it? In Google Analytics it is here: Conversions > Goals. Even if you are a content site the data is there. Details in the Goal URLs report. Setting up goals takes two minutes, setting goal values might take you a week (see measurement strategies here). If you use other tools, please check with your vendor.
+ Per Visit Goal Value
This Key Performance Indicator 1. helps you move beyond the obsession of focusing on the 2% (because it forces you to focus on Every Visit!) and 2. encourages you to create a business that uses the web to deliver multiple outcomes to your visitors.
per visit goal value
Every visitor will not convert, but every visitor will, hopefully, deliver some Economic Value. Looking at this metric helps you identify Goals that contribute higher value, and and understanding of simple things like where you should focus on. If Twitter delivers 87 cents of Per Visit Goal Value and Google delivers 97 cents then perhaps I want to keep focusing on my SEO strategies rather than following the advice of the Social Media Guru who's just informed me Search is dead.
Where is it? In pretty much every single report in every single web analytics tool. Click on the Goals tab.
That's it!
For a medium sized business we ended up with nine metrics. Seems about right if you are making more than five million dollars of economic value. They key difference from websites that are in the small business category is that we are going to shoot for multiple conversions, deeper site engagement and better analysis of acquisition efficiency.
Time now to deal with the big boys and girls… large websites!
Best Metrics / KPIs for Large Sized Business Websites
Acquisition:
CPA
Click-through Rate
+ % New Visits
My choice of this metric perhaps betrays my refusal to rest on my laurels. There are clearly a finite number of people in the world relevant for any business. But staying hungry and staying foolish is a popular mantra for me. I use this metric to constantly calibrate my acquisition strategy to understand which inbound marketing efforts are bringing new "impression virgins" to the business.
If you look at your Earned, Owned and Paid media then this metric is especially important for your Paid media efforts. Except for your re-targeting / behavior targeting campaigns, you want your paid search, display, affiliate, and social efforts to bring new visitors to your franchise.
Where is it? It's like air, everywhere! Don't forget to segment for optimal analysis.
Behavior:
Bounce Rate
Checkout Abandonment Rate
Page Depth
Loyalty (Count of Visits)
+ Events / Visit
Every awesome large website delivers complex experiences (videos, demos, dynamic slideshows, configurators + + +) via sophisticated technologies (Flash, AJAX, Gadgets + + +). Almost all of the time we leave measuring their effectiveness on faith (or the HiPPO). I love event tracking because it helps us measure these often astonishingly, expensive initiatives.
events per visit metric
Of 110,842 visits to the site, 9,054 interacted with your delightful experiences and each of those visits had 2.24 Events per Visit. Is that good? Bad? Could be better? Are these 2.24 interactions delivering higher economic value to your business?
In the above case the answer was a big NO. In your your case you'll decide based on your strategy and goals. At the end of the analysis you'll make significantly smarter decisions about your content (especially because the Analysis Ninja that you are, you'll triangulate performance of this metric with first, Page Depth and, second, Loyalty).
Where is it? Most web analytics tools do some type of event tracking. Please check with your vendor (it might not be called event tracking in their lingo, just describe my first paragraph above). In Google Analytics the data is here: Content > Events.
Outcomes:
Macro Conversion Rate.
Micro Conversion Rate
Per Visit Goal Value
+ Days to Conversion [or Time Lag for Content sites]
Another pan session metric I adore.
Life, no matter how hot you are, is not a series of one night stands. Yet because of how they analyze the data most companies end up optimizing their web marketing campaigns for one night stands. Come here and convert NOW! If yes: Oh, I love you. If no: Kill the campaign!
That approach is not just short-sighted; it is an insult to your visitors. Convert them at a pace they are most comfortable with. This metric helps you understand how quickly or slowly your visitors convert. You can, at the very minimum, change your campaign messaging and come hither calls to action and adjust your landing pages. If the Days to Conversion are much longer, then create a robust (slow dance) micro conversion strategy.
days to conversion time lag 1
If you have a non-ecommerce website then there is something delightful for you in the Google Analytics Multi-Channel Funnel reports. Checkout the Time Lag report . It is showing you exactly the same data as the Days to Transaction for Ecommerce sites. The metric you see immediately above is called Conversions. It is essentially your Goals (/micro conversions).
Optimize your "hello, nice to meet you, what would you like, here is what I have to offer, why don't you check with your spouse, come back and check it out again, multiple times, I'm still here, you ready to convert / deliver economic value, here's how… " process.
Where is it? Days to Conversion is in the Ecommerce section of your web analytics reports. It is a standard report. (Don't forget to segment your sources. Deep insights await.) Time Lag may or may not be a standard report in your tool. Please check with your vendor. In Google Analytics it is a standard report here: Conversions > Multi-Channel Funnels > Time Lag.
+ % Assisted Conversions
This is the newest metric I've made standard for all my clients / partners / BFFs. And it is a sweetie.
Assisted Conversions builds on the above mental model. It takes a while for a majority of your visitors to convert (macro and micro conversions), so why does almost all of web analytics focus on single channel analysis and optimizing that single channel in a silo? Just because the Affiliate click was the last one before conversion should it be optimized for that conversion? Especially if the Visitor originally came via Facebook (or Google or whatever)?
How many of your conversions had more than one ad / media / marketing touch prior to converting? Really smart Analysts at really successful companies understand that…
assist interaction analysis
…and then use that data to optimize the portfolio of channels rather than individual channels for the company.
Even if you don't do portfolio optimization (and desperately hope you do) you can easily see how the above data will cause you to execute a different marketing optimization and expectation strategy for Email (1.18 Assist / Last Interaction rate) vs. Organic Search (0.61).
I am being modest when I say that this metric and subsequent analysis will have a fantastic impact on your company.
Where is it? % Assist Conversions may or may not be in your web analytics tool. Please check with your vendor. In Google Analytics you'll find it here: Conversions > Multi-Channel Funnels > Assisted Conversions.
And we are done!
For large businesses we've identified 13 key metrics that would give a robust end-to-end view of business performance. The key difference vs. medium sized businesses is that we are really, really, really focused on pan-session (multiple visits) behavior. Put another way, we really care about people here and not just a single visit.
Here is a summary of the metrics I am recommending in this post…
best metrics small medium large business
I hope the picture above will quickly help diagnose where current gaps in your measurement strategy might be.
Additionally if you are a small business you'll know what else to measure when you start to become medium sized and if/when you cross that threshold you'll know the metrics that come with your large business status. :)
You'll notice that I'm not focusing on KPIs like AdSense Ads CTR or Page Load Time or Actions per Social Visit or Search Exits (I love this metric!) or Content Distribution vs. Content Consumption Rate or Conversation Rate (in case of a content site) etc. That's simply because these KPIs tend to be unique to the type of business you are running. My strategy above was to focus on just the KPIs that would be applicable across all types of businesses.
That brings me to a very important point.
While it is my hope that you'll find my recommendations above relevant and yummy… the most optimal way to identify that best key performance indicators for your company will come using the process and structure outlined in the Digital Marketing & Measurement Model.
I'll end with the thought I started this post with… we have more data than God wants anyone to have. But web analytics does not have to be scary or impenetrable. Use the roadmap above, focus on all three elements (acquisition, behavior, outcomes) and I promise you'll soon be on your way to being as happy as God wants everyone to be.
I wish you all the best!
Okay as always it's your turn now.
Does your business use the above recommended metrics / key performance indicators? Do you have an absolute favorite metric that's not mentioned above? Which metric above do you find most useful? Which one most useless? What is your strategy for identifying the most relevant metrics?
Please share your suggestions, critique, and helpful best practices via comments.
Thank you.
PS:
Couple other posts on metrics / KPIs you might find interesting: