Thursday, August 28, 2014

Google AdWords vs. Yahoo Bing Network – A PPC Performance Comparison

Search Engine Watch

Google

Google AdWords vs. Yahoo Bing Network – A PPC Performance Comparison

gregg-hamilton
, 20 Comments
Marin Software: Manage, optimize, and boost ROI on search, display, social, and mobile advertising.
Every search marketer knows Google dominates in U.S. search volume, handling two-thirds of all search queries. And yet, less is known about the entity that reportedly accounts for roughly the other third of searches – the Yahoo Bing Network (YBN).
This brings up a number of interesting questions for paid search marketers. For example:
  • Is Google dominant in every vertical?
  • How do the two engines compare on click-through rate (CTR) and cost per click (CPC)? 
  • Are paid search auctions as competitive on YBN as on AdWords?
AdGooroo (disclosure: I work there) addressed these questions in a recent study comparing the paid search performance of advertisers on Google AdWords and Yahoo Bing across six verticals in the U.S. during Q3 2012:
  • Shopping & Classified (composed of a broad range of retailers)
  • Financial Services
  • Travel
  • Education
  • Computer & Internet
  • Business to Business (B2B)
These vertical categories account for the majority of total search traffic and click-throughs in the U.S. search market.
adgooroo-yahoo-bing-adwords-average-cpc

AdWords Leads in Paid Search Spend, Clicks in All Verticals

AdWords delivered significantly higher impressions in five of the six categories studied – especially in the Shopping & Classified retail category, where it displayed 1.6 times as many first SERP ad impressions as YBN (an incremental 7.3 ad million impressions) during the quarter.
However, in the sixth category, Financial Services, YBN actually displayed more ad impressions than AdWords (although AdWords still yielded more total click-throughs within the vertical).
In addition to earning more search traffic, advertisers on AdWords generally experienced higher CTRs – with AdWords campaigns found to be 2.4 to 5.9 times higher than those on YBN during the period, depending on the vertical.
However, among the advertisers who were active on both engines, AdGooroo found some who actually had better CTRs on YBN than AdWords. For example, 9.5 percent of the Financial Services advertisers who sponsored paid search on both engines enjoyed higher CTRs on YBN than on AdWords, including Citicards and Fidelity Life. In the Shopping & Classified category, 5.7 percent of the overlapping advertisers had higher CTRs on YBN, including JCPenney, QVC, Old Navy, Kmartm and Shutterfly.

The Yahoo Bing Network Offers Certain Advantages

CPCs were almost invariably lower – and usually significantly lower – on YBN than AdWords – from 37 to 77 percent of AdWords' CPCs, again varying by vertical. So, advertisers were paying a high premium to gain access to AdWords' heartier search traffic and CTRs. And, as a result of lower CPCs, Brand Impressions (first SERP CPMs) varied from 76 to 90 percent cheaper, on average, on YBN than on AdWords.
The study also showed that there is significantly less competition on YBN than on AdWords. Across the six verticals studied, AdGooroo found 25,056 paid search advertisers on YBN receiving at least one first SERP ad impression, compared to 39,006 advertisers active on AdWords during the quarter. In other words, there were 36 percent fewer active search marketers on YBN to bid against.

What Does This Mean for PPC Marketers?

AdWords is the logical first choice for paid search advertisers for two reasons: superior impressions and click-through rates. However, YBN's advantages – lower CPCs and CPMs and less competition for ad position – offer a ripe, incremental opportunity for advertisers seeking to maximize their search efforts.
Even so, that notion doesn't appear to be widespread in the industry. Of the 41,548 advertisers who had paid search ads appear on either engine during Q3 2012, 42 percent (or 17,458) didn't record any ad exposures on YBN's first SERPs during the period. By comparison, only 6 percent (or 2,542) did not have first SERP ad exposures on AdWords.
The report's findings notwithstanding, over the last four years both search networks seem to be more or less fixed in place in terms of their share of domestic search volume. Time will tell whether that will change, and whether we'll see changes in the media buying habits of PPC marketers as well.

The Original Search Marketing Event is Back!
SES AtlantaSES Denver (Oct 16) offers an intense day of learning all the critical aspects of search engine optimization (SEO) and paid search advertising (PPC). The mission of SES remains the same as it did from the start - to help you master being found on search engines. Early Bird rates available through Sept 12. Register today!

Wednesday, August 27, 2014

3 A/B Testing Tools Compared


Web

3 A/B Testing Tools Compared

Jacco Blankenspoor
In my recent article that covered Google Analytics alternatives, someone asked a question in the comments about A/B testing. In response, two tools were mentioned: Optimizely and Visual Website Optimizer. In this post, I’m going to review these in addition to another one called Google Analytics Content Experiments, which offers simplified (but free) A/B testing functionality as part of the Analytics suite.
If you’re new to A/B testing in general, I recommend Kerry Butters’ articles Are Most Winning A/B Test Results Misleading? and The Designer’s Guide to A/B Testing, both of which include more basic info on what A/B testing is and why it’s important.
Now let’s go on to the reviews.

Optimizely

Let’s start by looking at Optimizely. They offer a decently priced entry plan with 2,000 visits per month, which is enough to run a few tests (or one large test). Optimizely requires you to insert a snippet of code in your header (which gets confirmed by email, which is nice) after which you can use their dashboard. You just add a new experiment, and a guide takes you through all the necessary steps.
I prepared an experiment to test whether Google Adsense link units should be put below (how it currently is) or above the navigation links. You can see the real page here to get an idea.
I can easily select the related code and make the switch. This is just a test, but if it was a real analysis I would also need to generate new Adsense code to measure the impact in earnings. But for now it’s the concept that matters.
Optimizely in action
If you run a very popular site, you can add one or more conditions to filter your traffic (like coming from a specific URL), as shown below:
Filter traffic with Optimizely
You can also set up goals to show up in your report, but I find the standard set very limited. You can compare on the basis of clicks, pageviews, or custom events that you have to set up yourself with JavaScript.
In their sales pitch, Optimizely states that you don’t have to be a coder to get it working. But if you want to do some serious tracking, some coding is still necessary. I think a more visual approach would be preferred. Coding shouldn’t be necessary after you’ve already placed their tracking script in your header.
Let’s say you want to compare different positions for a newsletter signup box, measuring the signup rate for each position. With Optimizely, you will have to insert some JavaScript code behind your form in addition to the tracking script. This seems redundant.
What about the results from my test? Well, this is the report I was shown.
An Optimizely Report
The results are still being collected, but this doesn’t really tell me anything since it isn’t clearly defined what these conversions are (probably clicks). This is just too limited.
Optimizely allows for a lot of integration with heatmap tools like CrazyEgg and ClickTale, and with various analytics tools (including GA). I think at these pricing levels at least some of that functionality should be included out of the box.
Optimizely looks impressive on paper and can certainly be a helpful tool if you don’t mind coding things. But I wish it was more click-and-play so you can stay focused on the testing.
Optimizely offers a free 30-day trial.

Visual Website Optimizer

Now let’s look at Visual Website Optimizer (VWO), which claims you won’t need to code at all. Their pricing is quite steep, but there’s a free trial. VWO begins by taking you through the steps needed to set up your experiment. After that you are given the code to insert, but you can also use plugins for most popular systems like WordPress and Magento.
I made the same change to my AdSense link units as with the Optimizely test by editing the HTML. There are a few more ways to modify your page. The easiest way for my example would be using the “Rearrange” function, but that wasn’t working with the AdSense code.
Visual Website Optimizer in action
After selecting and changing the HTML, I need to choose what I wanted to test. As you can see, I can be very specific about what to track when it comes to clicks on a link (if the test code allows for it). And there is a way to track signup forms. As with Optimizely, you can filter your traffic based on a whole range of conditions.
VWO filters
Choosing Current URL in VWO
A nice feature of VWO is that it comes with an integrated heatmap, thought it’s not as advanced as a dedicated heatmap tool. Too bad you can’t compare both heatmaps in your A/B tests. And they aren’t very advanced either, since the coloring doesn’t really tell you much. But it’s a nice idea that could improve with a little more development.
VWO's Heatmap Feature
VWO comes with a summary report and a detailed report, but to be honest these should be integrated with each other. The detailed report just adds some graphs and filters, but nothing really in-depth. The reports you do get are enough to help you in analyzing your results and use as a basis for further actions.
VWO's Summary Report
You get a little more information with VWO than with Optimizely. Engagement in this case is measured by overall clicks. Unfortunately I wasn’t able to track the actual clicks on the AdSense ads in the end, due to it being in an iframe.
Visual Website Optimizer gives the click-and-play experience I was missing with Optimizely, and gives you enough ways to measure how visitors respond to changes. The heatmap functionality is nice but not very useful in it’s current form. And even though reporting is a bit more than basic, it still feels too simple.
Visual Website Optimizer offers a free 30-day trial.

Google Analytics Experiments

To conclude this tools comparison, I will have a look at Google Analytics Content Experiments (GACE), previously known as Google Website Optimizer. GACE is a free A/B testing tool that’s part of Google Analytics. It only allows for pure split-testing, and you have to make the different variations yourself (i.e. set up new pages).
Google Analytics Content Experiments
To use GACE, you start by setting up your experiment and defining your objectives (which can also be predefined goals in GA, which is very helpful). You can also run experiments on Adsense results. Then you just have to define two or more testing pages (one being the original), insert some code it’s ready. You can even use your sales funnels and start split-testing these.
On one of my other sites, I have published a Liquid Web review. As you can see, there are prominent blue boxes displayed with a clear call to action. Changing colors requires you to copy the original page, and make the modifications yourself (like I did here). Also, you need to make sure your alternate page isn’t indexed by itself.
After you set up your experiment, you will immediately experience a major downside of GACE: You have to wait for 1-2 days to see results, unlike the two other tools, which are real-time. This means you can’t instantly act on the results coming in. With A/B testing it will definitely help to test over a combination of days, but if you are testing minor tweaks you’ll want to do a few variations per day so you can be sure which changes affected your conversions.
GACE doesn’t allow you to filter your traffic when setting up your experiment, you can only choose which percentage of your traffic should be included in the test.
Another (unnecessary) disadvantage of GACE is that it changes your URL to track the experiment:
GACE's tracking URL
While this doesn’t present major problems, it just isn’t very clean and also not very convenient when someone wants to bookmark your link (like I do a lot in Evernote).
GACE does give you the best reporting results in this comparison, because it allows you to compare based on different metrics. Even the ones you didn’t initially set up are shown, but a winner is defined on the metric you put in as objective.
GACE's Report
The Content Experiments functionality is very well integrated in the whole GA suite, which offers you some benefits over the other tools. When it comes to the testing itself, it’s rather limited and more time consuming to set it up. It also requires you to be patient. But it gives you an easy way to start with A/B testing without spending any money. And the AdSense integration is very valuable if you run an ad-supported site.

Conclusion

In summary, even though these three products seem to offer the same functionality, the way they handle things is very different.
Optimizely gives you lots of possibilities if you don’t mind coding some stuff together, while Visual Website Optimizer is more click-and-play. VWO comes with an extra tool for heatmap tracking, which is a nice feature but too limited. You can use both tools for both basic (changing elements) and advanced (filtering) experiments. But when it comes to reporting there is still room to improve. Documentation for both products is excellent, even if you just want to be educated on the different concepts of A/B testing.
With both products, it still feels like I’m missing important information though. Let’s take visitor origin for example. I can exclude certain segments of visitors so I can tell where they are not coming from, but wouldn’t it be nice to see if UK and US visitors are responding the same way to a change, and see that in a chart? Now it requires you to run two separate tests, and use a separate analytics tool. Maybe I’m asking too much here, but I believe there’s lot of potential in these tools since they already know so much about your traffic.
Both offer a free 30-day trial, so I encourage you to run some tests yourself.
Google Analytics Content Experiments is fully integrated with the rest of the GA suite, but is rather limited in the way tests are performed. It also requires more manual actions to make the adjustments, and you need to be patient before seeing results. But once you’ve set up a nice set of goals or funnels, it’s a great (and free) tool to use.
If you’ve used any of these or know of another tool, please let us know in the comments.
Jacco Blankenspoor
Jacco Blankenspoor is a website developer from the Netherlands, and is currently involved in job sites built on WordPress. You can see him in action at his current pet sites: Heathrow Airport Jobs and Airport Jobs, a job engine built on WordPress.

Experiment or Die. Five Reasons And Awesome Testing Ideas.

Occam's Razor
by Avinash Kaushik

Digital Marketing and Analytics Blog

Experiment or Die. Five Reasons And Awesome Testing Ideas.

collect
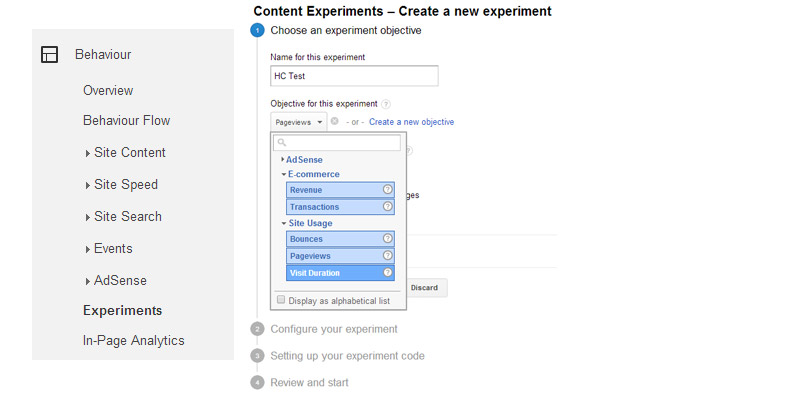
"Experiment or die, there is no try."
That was my call to action, Yoda inspired, last week to a group of international C-level executives. And I meant every word of it.
There is a tendency to think experimentation and testing is optional. Ouch!
I fundamentally believe that is wrong. For a few simple reasons:
# 1 It's Not Expensive!
You can start for free with a superb tool: Google's Website Optimizer. It is packed with enough features that I have no qualms flogging it (even though I work closely with the team!).
If you want to help our economy and pay for your tools then that is absolutely fabulous. Both Offermatica and Optimost are pretty nice options.
[Just don't fall for their bashing of all other vendors or their silly claims, false, of "superiority" in terms of running 19 billion combinations of tests or the bonus feature of helping you into your underwear each morning.
You'll be lucky if you can come up with 5 combinations, and it is not that hard to put on your underwear.
Look for actionable uniqueness. For example I am quite fond of the fact that with Offermatica you can "trigger" tests based on behavior. That is nice, well worth paying for.]
# 2 Six And A Half Minutes. That's it!
Tom has tried this with many many Marketers, and its so true: If you have fast leap two different pages you want to test, it takes six and a half minutes for you to configure, test (QA) and launch a A/B test.
[Please read that literally, as it is written. You have two pages already. 6.5 mis to: Configure. QA. Launch.]
You have six and half minutes right?
I cannot recommend enough the wisdom of starting with a A/B test.
You will start fast, you will find enough problems in your company, you can show easy wins.
Aim to get to the thing vendors are selling, MVT, but start with A/B regardless of the tool you use.
# 3 Show 'em You Are Worth It.
There is a lot of pressure on all of us to prove our worth and make significant improvements to our web business.
ClickStream analysis with Omniture or Google Analytics or ClickTracks is well and good, testing will get you on the path of taking having a direct impact faster.
By the nature of it Testing is action oriented, and what better way to show the HiPPO's that you are awesome then by moving the dial on that conversion rate in two weeks?
# 4 Big Bets, Low Risks, Happy Customers.
Very few people appreciate this unique feature of testing: You have an ability to take "controlled risks".
poker chips
Let's say you want to replace your home page with pictures of naked people, yes in the quest of engagement . : ) Naked people are risky, even if they are holding strategically placed Buy Now buttons.
So run a test where only 10% of the site traffic sees version B (naked people).
You have just launched something risky, yet you have controlled the risk by reducing exposure of the risky idea.
Stress this idea to your bosses, the fact that testing does not mean destroying the business by trying different ideas. You can control the risk you want to take.
# 5 Tags, CMS, Reports & Regressions: All Included!
all in one box 
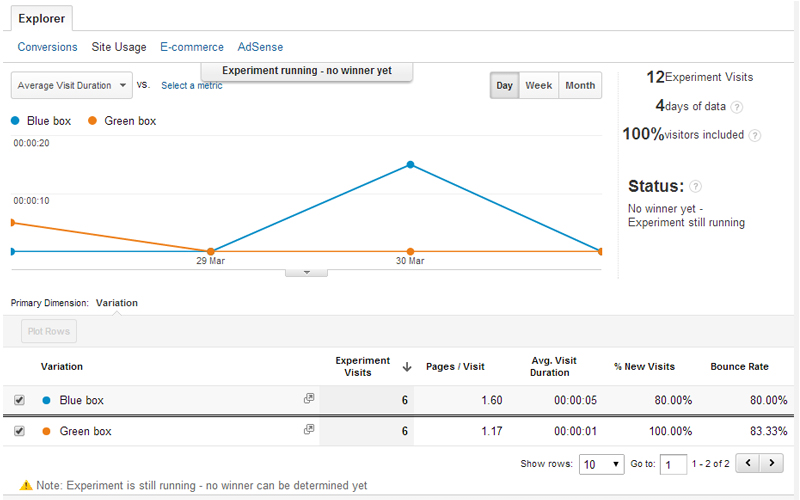
Pretty much all Testing tools are self contained, simple to launch (A/B is brain dead easy, MultiVariate needs your brain to be awake – that's not hard is it?), they contain all reporting built in and the data is not that hard to understand.
So you don't have to worry about integrations with analytics tools, you don't have to worry about rushing to get a PhD in Statistics to interpret results and what not.
You will hear super lame arguments about mathematical purity or my factorial is better and the other guy's whatever. Ignore. It will take you a while to hit those kinds of limits. And the nice thing is by then you'll be smart enough to make up your own mind.
What's important is you start. Do that today. Think of this as dating and not a marriage. You are allowed to make mistakes. You are not going to marry the first guy you run into. Don't take that approach here.
So agree with me? This is attractive? Right?
Think about it this way. If your analytics career is flagging then testing is the Viagra you need to take.
Seriously.
: )
So as my tiny gift for you here are five experimentation and testing ideas for you. I'll try to go beyond the normal stuff you hear at other sources.
# 1 Fix The Biggest Loser, Landing Page. (& Be Bold.)
Now all that is well and good. But the sad thing in a common mistake people make is get excited and then go try to test Add To Cart buttons. Or three different hero images on the home page.
That's all well and good. But honestly that's not going to rock your boat. [Remember you are on Viagra!]
For your first test be bold, try something radical, bet big. I know that sounds crazy. But remember you can control risk.
If you start with a A/B test with some substantial difference then you can show value of testing faster because you'll get a signal faster, you'll start the emotional change required to embrace testing across the organization.
My favorite place to start, is the Top Landing Pages report (or Top Entry Pages if that's what your vendor calls it) from your web analytics tool.
Find the biggest loser, the one with the highest bounce rate.
volvo hybrid cars landing page
Click and look at the sites sending traffic to this page, look at the keywords driving traffic to this page. That will give you clues about customer intent (where people come from, and why).
Come up with two different (bold) ways to represent that page and deliver on that customer intent.
Your first A / B / C test.
# 2 Test a Single Page vs. Multi Page Checkout.
One of the highest ways to improve conversion is to reduce Cart & Checkout Abandonment rates. Take money from people who want to give you money!
Some websites have a one page checkout process: Shipping, billing, review and submit.
Some have it on four pages.
I have seen both work, you never know, it really depends on the types of visitors you attract.
checkout options
So if you have a single page why not try the multi (if your abandonment rate is high, say more than 20% :). Or vise a versa?
I have seen very solid improvements in these tests.
Or here's a bonus. Many shopping cart (or basket to my British friends) pages have a Apply Coupon Code box. This seems to case people to open Google and search for codes. So why not move this coupon code box to the Review Before Submit page?
It won't send those who don't have a coupon code looking for one, and by the Review Order page they are way too committed. For those that have a coupon code they can still apply it.
In both these scenarios you are helping your organization find value quickly by touching a high impact area.
And remember, this works for lead submission forms and other such delights.
# 3 Optimize the Number of Ads & Layout of Ads.
Ad supported sites are numerous. And the there is so little restraint, the core idea seems to be let's slap as many ads on the site as we can.
More ads = more clicks = more revenue.
Usually this is never tested.
vgno ads
[I can't read Norwegian so this could be wrong, but I counted a total of 19 ads on this page! Ten above the fold. Important point: American sites are just the same.]
So test the number of ads you should have on a page. Its not that hard. It can be a simple A/B test or a MultiVariate test.
In a memorable test the client actually reduced the number of ads on the page by 25% and the outcomes improved by 40%. I kid you not, 40%. And guess in which version customers were happier.
There is a built in assumption there that you are simply not selling impression, in which case pile on the ads in the pages. You are not being held accountable for outcomes so enjoy the ad party.
Here's a bonus idea.
There are sites were the ad is in the header, it takes up the whole header and is the first thing that loads. I have only seen one case where that worked.
information week ad in header
The header takes up 30% of the space above the fold on a 1024 resolution.
So if that is you why not try a test with the header ad and without? See which one improves overall conversion / outcomes?
The other bonus idea is to try different ad layouts. Most people have banner blindness, top of the page and in the middle of the content (as in Yahoo news).
Why not try different layouts and formats? If not to see which one works the best then to just annoy your customers? :)
# 4 Test Different Prices / Selling Tactics.
You can of course test different pretty images, why not try to reinvent your business model using testing?
A company was selling just four products. But the environment got tough, the competitors got competitive. How to fight back? Some "genius" in the company had an idea "Why don't we give our cheapest product, currently $15, away for free?"
CMO says: Radical idea. CEO says: Are you insane? CFO says: No way!
Now it did present a fundamental challenge, no one like to give revenue up. And people worried about how successful it would be, what would be the revenue impact, why would anyone buy a non-free version etc etc.
Rather than create prediction models (with faulty assumptions!) or giving up in face of the HiPPO pressure, the Analytics team just launched a A/B test. And they controlled for risk (after all the CFO did not want to go bankrupt) by doing a 95% control and 5% version A test.
testing product price points
Perhaps unsurprisingly the free version of the product sold lots of copies.
That was not surprising.
What was surprising was that free helped shift the sku mix in a statistically significant way, i.e the presence of free caused more people to buy the more expensive options. Interesting. [In a delightfully revenue impacting way!]
The other positive side effect was to cause lots of new customers to be introduced to the franchise, as they "purchased" the free version. Lovely.
Here are some bonus ideas.
If you give discounts try 15% off vs $10 off (people tend go for the latter! :)).
Try $25 mail in rebate vs $7 instant rebate (or change amounts to suit).
You get the idea.
# 5 Test Box Layouts, DVD Covers, Offline Stuff.
Let's say you are launching a new product or a dvd or something similar. You want to figure out what layout might be more appealing to people in stores.
thank you for smokingYou could ask your mom to pick a version she likes.
You could ask your agency to ask a few people.
Or you could launch a test online and see which version is rated highest by your website visitors!
I have done tests for DVD covers and the results were surprising.
Or here's another idea…
You are a multi channel customer. You sell bikinis. Now you want to sell Accounting Software. Why not try it on your website before you reconfigure your stores?
Or you are Wal-Mart and it is expensive and takes a long time for you to put new products in your stores. That makes it risky to start stocking the "on paper hideous but perhaps weirdly appealing" Zebra Print Occasional Chairs in your store. What if it bombs?
Well why not add it to your site, see if it sells. If it gets 15 positive customer reviews (!!), then you know you have a winner on your hands.
The actual launch process is faster, you can reduce risk, and you don't have to rely on just your company employees (the fashion mavens) from picking winners and losers.
All done.
I hope that you'll find both compelling reasons for starting experimentation and I have managed to stretch your mind beyond "honey let's start testing shopping cart buttons".
There is so much you can do. This recession season buy your CEO the gift that keeps giving, a experimentation and testing tool.
Here's a summary for you. . . .
Five reasons for online Experimentation & Testing:
    #1 It’s Not Expensive!
    #2 Six And A Half Minutes. That’s it!
    #3 Show ‘em You Are Worth It.
    #4 Big Bets, Low Risks, Happy Customers.
    #5 Tags, CMS, Reports & Regressions: All Included!
Five off the beaten track Experimentation & Testing ideas:
    #1 Fix The Biggest Loser, Landing Page. (& Be Bold.)
    #2 Test a Single Page vs. Multi Page Checkout.
    #3 Optimize the Number of Ads & Layout of Ads.
    #4 Test Different Prices / Selling Tactics.
    #5 Test Box Layouts, DVD Covers, Offline Stuff.
Ok now its your turn.
What are the reasons your company is not jumping on the awesome testing bandwagon? If it did, what finally convinced them? If you are doing testing, care to share some of your ideas? Anything off the beaten path you have tried? Any massive failures?
Please share your feedback, insights and stories.
Thank you.
PS:
Couple other related posts you might find interesting:

Segmenting Brand and Generic Paid Search Traffic in Google Analytics


Segmenting Brand and Generic Paid Search Traffic in Google Analytics

Thursday, June 26, 2014 | 11:09 AM
Labels: , ,
Many advertisers with paid search campaigns advertise on queries mentioning their brand (e.g., “Motorola smartphone” for Motorola) and also on generic searches (e.g., “smartphone reviews”). Because the performance metrics for ads shown against brand and generic queries can be vastly different, many advertisers prefer to analyze these two groups separately.  For example, all else being equal, searches containing the advertiser’s brand name often have higher clickthrough-rates than those that don’t.
Automatic classification
To make analysis of brand and generic performance as easy as possible, we’re introducing a new feature which automatically identifies brand-aware paid search clicks tracked in Google Analytics. We use a combination of signals (including the clickthrough-rate, text string, domain name and others) to identify query terms which show awareness of your brand.  You can review our suggested brand terms and then accept or decline each of them. It’s also easy to add additional brand terms that we’ve missed. 
With the resulting list of brand terms, we classify your paid search traffic in GA so that you can split your “paid search” channel into two separate channels: “brand paid search” and “generic paid search”. This can be done both for Multi-Channel Funnels (for attribution purposes) and for the main Google Analytics channel grouping. See this straightforward step-by-step guide to get started.
Industry feedback
Back in 2012, George Michie from the Rimm-Kaufmann Group, a leading online marketing agency, called analyzing brand and generic paid search together “the cardinal sin of paid search”. We showed him a preview of our new solution and here’s his reaction:
"I've been arguing for many years that advertisers should look at their brand and generic paid search separately. There are massive differences in overall performance - but also in more specific areas, like attribution and new customer acquisition. 
Google Analytics now makes it a lot easier for advertisers to segment brand and generic paid search into separate channels. I'm sure this feature will help many more advertisers measure these important differences - and more importantly, take action on these new insights."
Getting started
Finally: note that this feature works for all paid search advertising, not just Google AdWords. It will roll out to all users in the coming weeks.
To get started, use the step-by-step guide to set up separate brand paid search and generic paid search channels. We’ve already suggested brand terms for every GA view with sufficient paid search traffic.

Posted by: Frank Uyeda, Software Engineer, Google Analytics

U.S. Cellular reveals true impact of digital media on sales with Google Analytics Premium


U.S. Cellular reveals true impact of digital media on sales with Google Analytics Premium

Wednesday, July 23, 2014 | 10:24 AM
Labels: ,
With 10.6 million cell phone customers and retail stores in 400+ markets, U.S. Cellular needs to reach a lot of people with marketing messages. That's why U.S. Cellular uses many marketing channels -- online, in-store and telesales -- to drive mobile phone activations.
U.S. Cellular was challenged though. They didn’t know how many of their offline sales were driven by their digital marketing. This made it harder to adjust their media mix accordingly and also to forecast sales. To fix that situation, U.S. Cellular and its digital-analytics firm, Cardinal Path, turned to Google Analytics Premium and its integration with BigQuery
Part of Google Cloud Platform, BigQuery allows for highly flexible analysis of large datasets. The U.S. Cellular team used it to integrate and analyze terabytes of data from Google Analytics Premium and other systems. Then they mapped consumer behavior across online and offline marketing channels. Each transaction was attributed to the consumer touchpoints that the buyer had made across various sales channels. 
The result: U.S. Cellular got real insight into digital’s role in their sales. They were surprised to find that they could reclassify nearly half of all their offline activations to online marketing channels.
U.S. Cellular now uses this complete (and fully automatic) analytics framework to really see the consumer journey and forecast sales for each channel. Their team has the data they need to make better business decisions. 
“We’re now in the enviable position of having an accurate view at each stage of our customer journey," says Katie Birmingham, a digital & e-commerce analyst for the company. "The Google Analytics Premium solution not only gives us a business advantage, but helps us shape a great customer experience, and ultimately ties in to our values of industry-leading innovation and world-class customer service.”
Posted by: Suzanne Mumford, Google Analytics Premium Marketing

The ABC’s of Branding


Before we get to the ABC’s, it is imperative that you know with absolute certainty that you can offer and deliver, better than anyone else, a quality service solution that solves a current problem or a valuable product that fills a current need.
Once you are sure of this, and you spend the time to know your ABC’s, you will gain market acceptance and fans over time to build your solid brand foundation. Here are the ABC’s of successful branding:

Authenticity: Be true to you

A common definition of “Authenticity” in Psychology refers to the attempt to live one’s life according to the needs of one’s inner being, rather than the demands of society or one’s early conditioning.  Authenticity is the degree to which one is true to one’s own personality, spirit, or character, despite society pressures.
Anybody who is pretending to be anything other than who they really are will never be able to reach their full personal potential.  Find the ability to be yourself: Bring heart and truth to what you do.  Don’t imitate.  Be yourself and do it your way.
Make sure your outer world matches your inner world.

Benefits: This is what customers care about

Benefits are what make your customers life easier, more enjoyable, more exciting, and more rewarding.  Benefits are solutions to your customer’s day-to-day problems.  Benefits are what customers pay for.  Benefits are the only profitable way to bring new customers to your business.
Many marketers would agree that we buy products and services that enhance our positive sense of self-esteem, in some way.  They believe that all brands, products and their features are associated with a rewarding emotional payoff.  Moreover, all features and benefits are linked to emotional end benefits.
Include the…”What’s in it for the customer?”

Communication: You are always communicating

Communication is the activity of conveying meaningful information.  Even non-communication is a form of communication.  Communication requires a sender, a message, and an intended recipient, although the receiver need not be present or aware of the sender’s intent to communicate at the time of communication; thus communication can occur across vast distances in time and space.
Communication requires that the communicating parties share an area of commonality. The communication process is complete once the receiver has understood the message of the sender.
You have the power to reach or repel your target audience.
A brand should translate your business {passion & purpose} into language and visuals that clearly communicate you and your promise, then you must deliver on this to establish and earn your credibility.  Your authentic brand should show what people can expect from your business in a compelling manner to attract your target audience.
The following two tabs change content below.
Avatar of Kathy Bass, Ladies Who Brand
Kathy is an Entrepreneur, a Personal Branding Strategist and Founder of Ladies Who Brand, Inc. Kathy has a background in Business, Marketing, Psychology and Design and is the Phoenix Branding Examiner for Thomson Reuters. Currently, Kathy is writing a Branding D.I.Y. Guidebook for anyone with a passion to start their own business who wants to learn how to “Survive & Thrive” in our new digital world with our new media and new rules. Want to understand the power of branding? Follow me on Twitter or find me on Facebook.